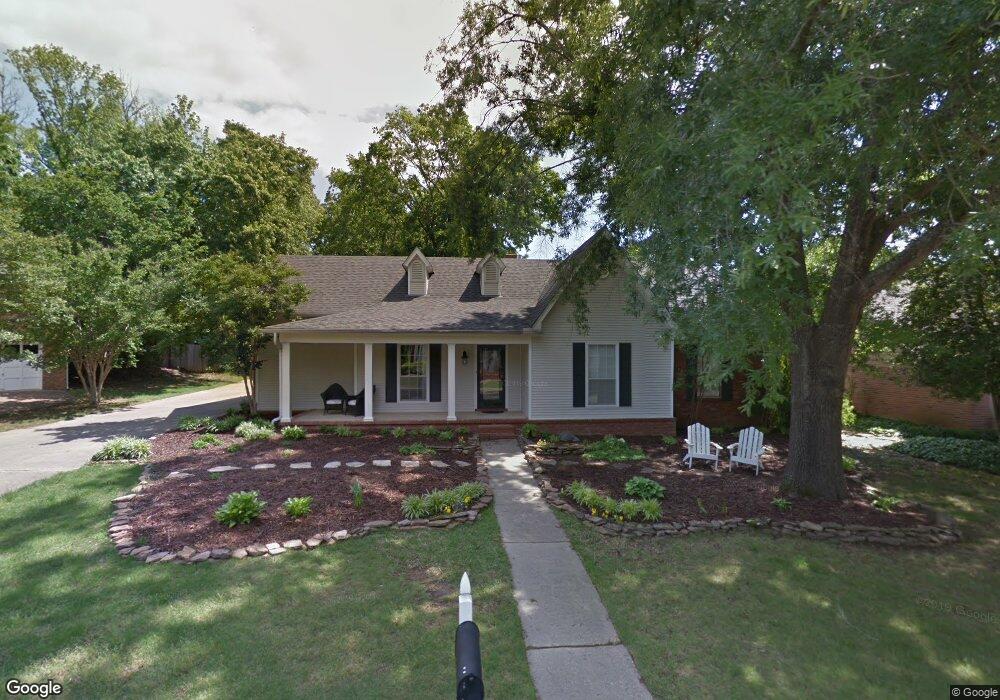
1613 Scandia Benton, AR 72019
Estimated Value: $248,000 - $291,000
--
Bed
2
Baths
1,892
Sq Ft
$140/Sq Ft
Est. Value
About This Home
This home is located at 1613 Scandia, Benton, AR 72019 and is currently estimated at $264,529, approximately $139 per square foot. 1613 Scandia is a home located in Saline County with nearby schools including Caldwell Elementary School, Benton Middle School, and Benton Junior High School.
Ownership History
Date
Name
Owned For
Owner Type
Purchase Details
Closed on
Jun 1, 1993
Bought by
Ross
Current Estimated Value
Create a Home Valuation Report for This Property
The Home Valuation Report is an in-depth analysis detailing your home's value as well as a comparison with similar homes in the area
Home Values in the Area
Average Home Value in this Area
Purchase History
| Date | Buyer | Sale Price | Title Company |
|---|---|---|---|
| Ross | $112,000 | -- |
Source: Public Records
Tax History Compared to Growth
Tax History
| Year | Tax Paid | Tax Assessment Tax Assessment Total Assessment is a certain percentage of the fair market value that is determined by local assessors to be the total taxable value of land and additions on the property. | Land | Improvement |
|---|---|---|---|---|
| 2025 | $1,875 | $45,408 | $8,320 | $37,088 |
| 2024 | $1,919 | $45,408 | $8,320 | $37,088 |
| 2023 | $1,450 | $45,408 | $8,320 | $37,088 |
| 2022 | $1,500 | $45,408 | $8,320 | $37,088 |
| 2021 | $1,500 | $35,020 | $6,400 | $28,620 |
| 2020 | $1,500 | $35,020 | $6,400 | $28,620 |
| 2019 | $1,500 | $35,020 | $6,400 | $28,620 |
| 2018 | $1,440 | $35,020 | $6,400 | $28,620 |
| 2017 | $1,359 | $35,020 | $6,400 | $28,620 |
| 2016 | $1,669 | $29,430 | $4,800 | $24,630 |
| 2015 | $1,289 | $29,430 | $4,800 | $24,630 |
| 2014 | $1,301 | $29,430 | $4,800 | $24,630 |
Source: Public Records
Map
Nearby Homes
- 1718 Rock Creek Dr
- 1710 Hidden Valley Dr
- 2512 Volcanic
- 1045 Cambridge Cir
- 2509 Twin Oaks Ct
- 1190 Cambridge Cir
- 1024 River Oaks
- 1023 Red Oak Cir
- 1107 J Cove W
- 1126 Heights Rd
- Lot 111 River Oaks
- Lot 112 River Oaks
- 1108 River Oaks
- 816 Teresa Dr
- Lot 2 Woodland
- 1307 River Oaks
- 1 Azalea Cir
- 721 W Narroway St
- 722 W Narroway St
- 508 W Saline Cir
- 1609 Scandia
- 1617 Scandia
- 1608 Hidden Valley Cove
- 1612 Scandia
- 1600 Hidden Valley Cove
- 1605 Scandia
- 1612 Hidden Valley Cove
- 1608 Scandia
- 1803 Rock Creek Dr
- 1618 April Sound
- Lot 180 April Sound St
- 1614 April Sound
- 1601 Scandia
- 1604 Scandia
- 1700 Hidden Valley Cove
- 1607 April Sound
- 1607 Hidden Valley Cove
- 1611 Hidden Valley Dr
- 1611 Hidden Valley Cove
- 1612 April Sound