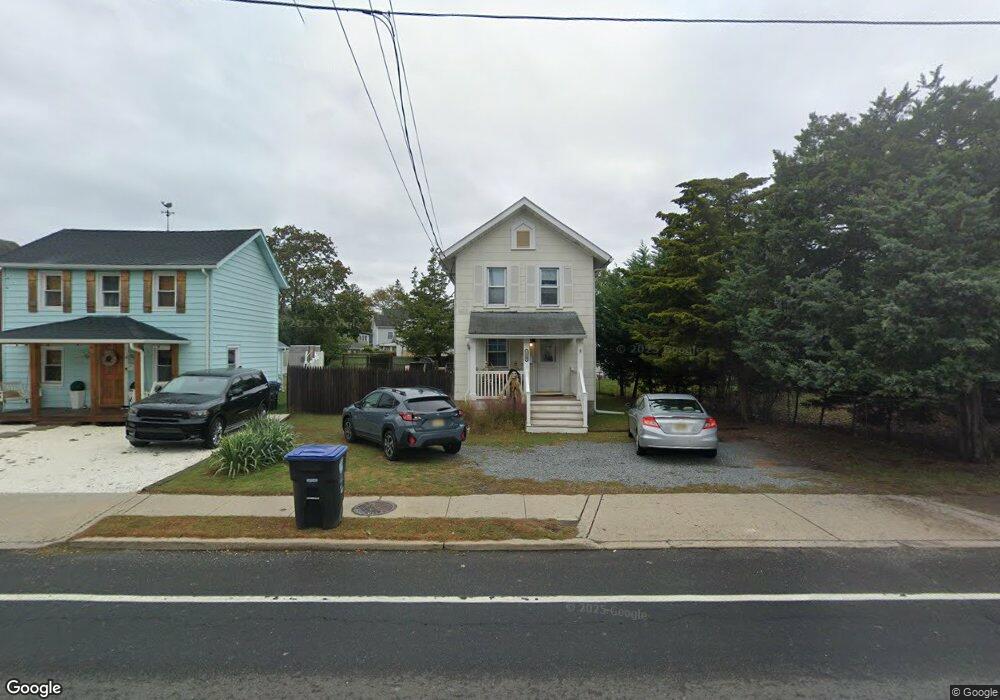
1613 State Route 71 Belmar, NJ 07719
Estimated Value: $584,000 - $626,496
2
Beds
2
Baths
1,152
Sq Ft
$525/Sq Ft
Est. Value
About This Home
This home is located at 1613 State Route 71, Belmar, NJ 07719 and is currently estimated at $604,374, approximately $524 per square foot. 1613 State Route 71 is a home located in Monmouth County with nearby schools including Wall High School, St. Rose Grammar School, and St Rose High School.
Ownership History
Date
Name
Owned For
Owner Type
Purchase Details
Closed on
Sep 25, 2020
Sold by
Salmon Ronald J and Salmon Jane
Bought by
Salmon Ronald J and Salmon Jane
Current Estimated Value
Home Financials for this Owner
Home Financials are based on the most recent Mortgage that was taken out on this home.
Original Mortgage
$253,000
Outstanding Balance
$225,030
Interest Rate
2.9%
Mortgage Type
New Conventional
Estimated Equity
$379,344
Purchase Details
Closed on
Jun 29, 2000
Sold by
Leroy Leonard
Bought by
Salmon Ronald and Bunk Jane
Home Financials for this Owner
Home Financials are based on the most recent Mortgage that was taken out on this home.
Original Mortgage
$119,019
Interest Rate
8.55%
Mortgage Type
FHA
Purchase Details
Closed on
Mar 18, 1996
Sold by
Graves Thomas
Bought by
Leroy Leonard Colleen
Home Financials for this Owner
Home Financials are based on the most recent Mortgage that was taken out on this home.
Original Mortgage
$89,000
Interest Rate
6.99%
Mortgage Type
FHA
Create a Home Valuation Report for This Property
The Home Valuation Report is an in-depth analysis detailing your home's value as well as a comparison with similar homes in the area
Home Values in the Area
Average Home Value in this Area
Purchase History
| Date | Buyer | Sale Price | Title Company |
|---|---|---|---|
| Salmon Ronald J | -- | Property Transfer Svcs Inc | |
| Salmon Ronald J | -- | None Listed On Document | |
| Salmon Ronald | $120,000 | -- | |
| Leroy Leonard Colleen | $90,000 | -- |
Source: Public Records
Mortgage History
| Date | Status | Borrower | Loan Amount |
|---|---|---|---|
| Open | Salmon Ronald J | $253,000 | |
| Closed | Salmon Ronald J | $253,000 | |
| Previous Owner | Salmon Ronald | $119,019 | |
| Previous Owner | Leroy Leonard Colleen | $89,000 |
Source: Public Records
Tax History Compared to Growth
Tax History
| Year | Tax Paid | Tax Assessment Tax Assessment Total Assessment is a certain percentage of the fair market value that is determined by local assessors to be the total taxable value of land and additions on the property. | Land | Improvement |
|---|---|---|---|---|
| 2025 | $5,869 | $274,000 | $206,000 | $68,000 |
| 2024 | $5,724 | $274,000 | $206,000 | $68,000 |
| 2023 | $5,724 | $274,000 | $206,000 | $68,000 |
| 2022 | $5,546 | $274,000 | $206,000 | $68,000 |
| 2021 | $5,546 | $274,000 | $206,000 | $68,000 |
| 2020 | $5,475 | $274,000 | $206,000 | $68,000 |
| 2019 | $5,412 | $274,000 | $206,000 | $68,000 |
| 2018 | $5,351 | $274,000 | $206,000 | $68,000 |
| 2017 | $5,244 | $274,000 | $206,000 | $68,000 |
| 2016 | $5,116 | $274,000 | $206,000 | $68,000 |
| 2015 | $4,430 | $148,800 | $74,000 | $74,800 |
| 2014 | $4,240 | $145,800 | $71,000 | $74,800 |
Source: Public Records
Map
Nearby Homes
- 923 Woodland Ave
- 823 13th Ave
- 1223 Briarwood Rd
- 1208 L St
- 1204 River Rd
- 1630 Oakwood Rd
- 704 15th Ave
- 1012 Glenn St
- 1014 Glenn St
- 1024 17th Ave
- 708 18th Ave
- 1208 Pine Tree Way
- 1813 Margerum Ave
- 615 17th Ave
- 620 Redmond Ave
- 1000 River Rd Unit 4G
- 737 20th Ave
- 517 14th Ave
- 1800-1802 Pine Terrace
- 516 13th Ave
- 1615 State Route 71
- 901 Woodland Ave
- 1617 State Route 71
- 905 Woodland Ave
- 1619 State Route 71
- 1616 New Jersey 71
- 1609 State Route 71
- 1614 State Route 71
- 902 Curtis Ave
- 907 Woodland Ave
- 902 Woodland Ave
- 1616 State Route 71
- 904 Woodland Ave
- 904 Curtis Ave
- 909 Woodland Ave
- 1618 State Route 71
- 906 Curtis Ave
- 911 Woodland Ave
- 901 Curtis Ave
- 908 Woodland Ave