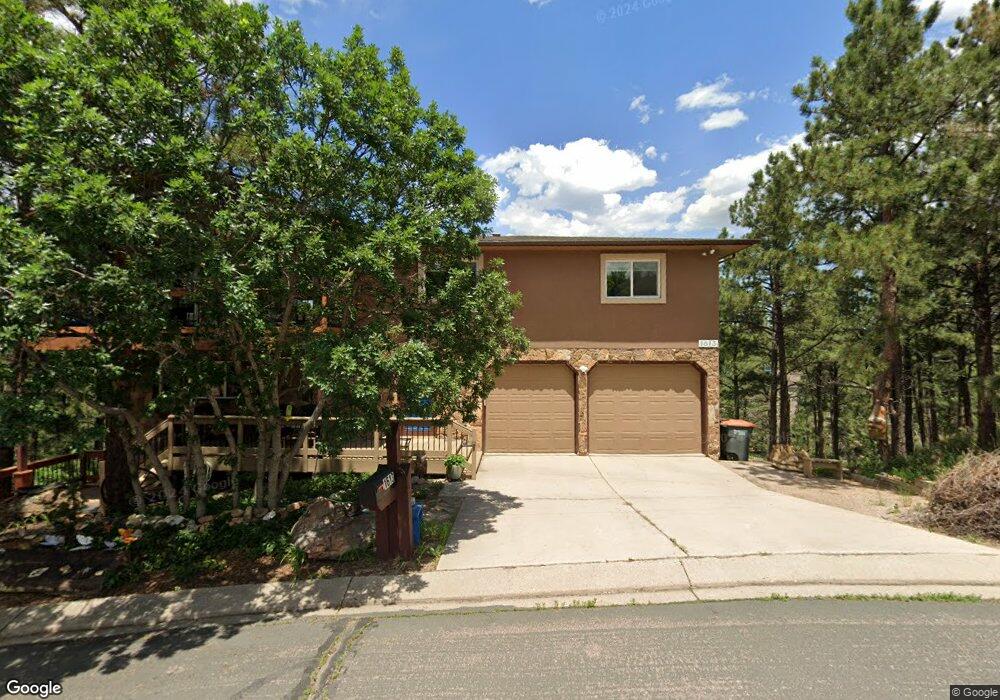
1613 Vickers Dr Colorado Springs, CO 80918
Pulpit Rock NeighborhoodEstimated Value: $632,000 - $774,000
3
Beds
3
Baths
2,827
Sq Ft
$241/Sq Ft
Est. Value
About This Home
This home is located at 1613 Vickers Dr, Colorado Springs, CO 80918 and is currently estimated at $682,367, approximately $241 per square foot. 1613 Vickers Dr is a home located in El Paso County with nearby schools including Fremont Elementary School, Russell Middle School, and Coronado High School.
Ownership History
Date
Name
Owned For
Owner Type
Purchase Details
Closed on
Jun 17, 2024
Sold by
Montoya Charles E and Bahe Laurel S
Bought by
L S Bahe And C E Montoya Revocable Living Tru
Current Estimated Value
Purchase Details
Closed on
Mar 30, 1995
Sold by
Arnold Jim and Arnold Marsha
Bought by
Bahe Laurel S and Montoya Charles E
Purchase Details
Closed on
May 7, 1993
Bought by
Montoya Charles E
Purchase Details
Closed on
Jul 11, 1991
Bought by
Montoya Charles E
Purchase Details
Closed on
Sep 1, 1980
Bought by
Montoya Charles E
Create a Home Valuation Report for This Property
The Home Valuation Report is an in-depth analysis detailing your home's value as well as a comparison with similar homes in the area
Home Values in the Area
Average Home Value in this Area
Purchase History
| Date | Buyer | Sale Price | Title Company |
|---|---|---|---|
| L S Bahe And C E Montoya Revocable Living Tru | -- | None Listed On Document | |
| Bahe Laurel S | -- | -- | |
| Montoya Charles E | $148,000 | -- | |
| Montoya Charles E | $126,500 | -- | |
| Montoya Charles E | -- | -- |
Source: Public Records
Tax History Compared to Growth
Tax History
| Year | Tax Paid | Tax Assessment Tax Assessment Total Assessment is a certain percentage of the fair market value that is determined by local assessors to be the total taxable value of land and additions on the property. | Land | Improvement |
|---|---|---|---|---|
| 2025 | $2,238 | $44,690 | -- | -- |
| 2024 | $1,749 | $44,760 | $10,520 | $34,240 |
| 2023 | $1,749 | $44,760 | $10,520 | $34,240 |
| 2022 | $1,514 | $34,000 | $7,730 | $26,270 |
| 2021 | $1,642 | $34,980 | $7,950 | $27,030 |
| 2020 | $1,486 | $29,050 | $6,130 | $22,920 |
| 2019 | $1,478 | $29,050 | $6,130 | $22,920 |
| 2018 | $1,123 | $22,510 | $5,620 | $16,890 |
| 2017 | $1,064 | $22,510 | $5,620 | $16,890 |
| 2016 | $823 | $22,150 | $5,900 | $16,250 |
| 2015 | $819 | $22,150 | $5,900 | $16,250 |
| 2014 | $755 | $20,510 | $5,900 | $14,610 |
Source: Public Records
Map
Nearby Homes
- 5810 Spurwood Ct
- 5514 Saxon Ln
- 5811 Spurwood Ct
- 5880 Cliffside Terrace
- 1860 Erin Loop
- 1858 Erin Loop
- 1635 Rockhurst Blvd
- 5925 - 5943 University Village View
- 2061 - 2091 Furman Point
- 5536 Sonnet Heights
- 1725 Applewood Ridge Ct
- 5950 Ridge Brook Ln
- 5555 Denmark Ct
- 1914 Erin Loop
- 1918 Erin Loop
- 1920 Erin Loop
- 1926 Erin Loop
- 1928 Erin Loop
- 1930 Erin Loop
- 1932 Erin Loop
- 1609 Vickers Dr
- 1617 Vickers Dr
- 1602 Vickers Dr
- 5830 Spurwood Ct
- 1606 Vickers Dr
- 1621 Vickers Dr
- 5826 Spurwood Ct
- 1601 Vickers Dr
- 1605 Vickers Dr
- 5834 Spurwood Ct
- 1610 Vickers Dr
- 1710 Colgate Dr
- 1625 Vickers Dr
- 5822 Spurwood Ct
- 1720 Colgate Dr
- 1690 Colgate Dr
- 5835 Spurwood Ct
- 1629 Vickers Dr
- 1614 Vickers Dr
- 1730 Colgate Dr