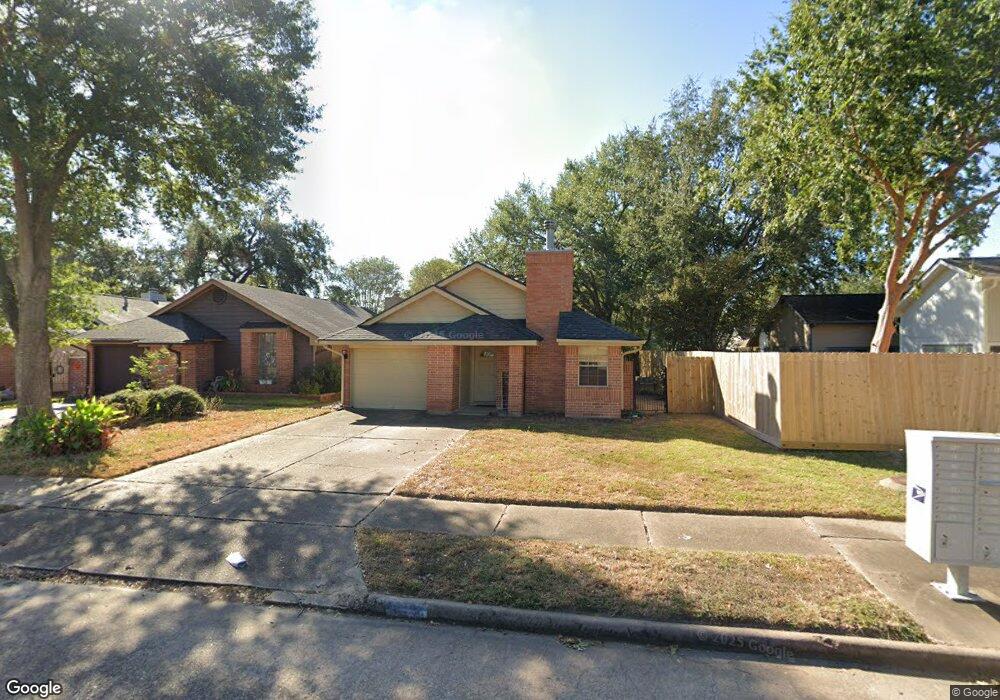
16131 Manor Point Dr Houston, TX 77095
Copperfield NeighborhoodEstimated Value: $212,856 - $237,000
3
Beds
2
Baths
1,134
Sq Ft
$201/Sq Ft
Est. Value
About This Home
This home is located at 16131 Manor Point Dr, Houston, TX 77095 and is currently estimated at $227,464, approximately $200 per square foot. 16131 Manor Point Dr is a home located in Harris County with nearby schools including Fiest Elementary School, Labay Middle School, and Cypress Falls High School.
Ownership History
Date
Name
Owned For
Owner Type
Purchase Details
Closed on
Oct 5, 2007
Sold by
Shrimpton Shelly
Bought by
Allison Dani
Current Estimated Value
Home Financials for this Owner
Home Financials are based on the most recent Mortgage that was taken out on this home.
Original Mortgage
$99,655
Outstanding Balance
$63,091
Interest Rate
6.48%
Mortgage Type
Purchase Money Mortgage
Estimated Equity
$164,373
Purchase Details
Closed on
Sep 20, 2002
Sold by
Dignon Patricia A
Bought by
Shrimpton Shelly
Home Financials for this Owner
Home Financials are based on the most recent Mortgage that was taken out on this home.
Original Mortgage
$90,150
Interest Rate
6.25%
Purchase Details
Closed on
Dec 6, 1996
Sold by
Burton Gary A and Burton Denise L
Bought by
Dignon Patricia A
Home Financials for this Owner
Home Financials are based on the most recent Mortgage that was taken out on this home.
Original Mortgage
$52,250
Interest Rate
7.77%
Create a Home Valuation Report for This Property
The Home Valuation Report is an in-depth analysis detailing your home's value as well as a comparison with similar homes in the area
Home Values in the Area
Average Home Value in this Area
Purchase History
| Date | Buyer | Sale Price | Title Company |
|---|---|---|---|
| Allison Dani | -- | Chicago Title | |
| Shrimpton Shelly | -- | Charter Title Company | |
| Dignon Patricia A | -- | American Title Co |
Source: Public Records
Mortgage History
| Date | Status | Borrower | Loan Amount |
|---|---|---|---|
| Open | Allison Dani | $99,655 | |
| Previous Owner | Shrimpton Shelly | $90,150 | |
| Previous Owner | Dignon Patricia A | $52,250 |
Source: Public Records
Tax History Compared to Growth
Tax History
| Year | Tax Paid | Tax Assessment Tax Assessment Total Assessment is a certain percentage of the fair market value that is determined by local assessors to be the total taxable value of land and additions on the property. | Land | Improvement |
|---|---|---|---|---|
| 2025 | $2,532 | $228,046 | $56,100 | $171,946 |
| 2024 | $2,532 | $222,207 | $46,860 | $175,347 |
| 2023 | $2,532 | $219,719 | $46,860 | $172,859 |
| 2022 | $3,904 | $195,919 | $33,440 | $162,479 |
| 2021 | $3,739 | $161,058 | $33,440 | $127,618 |
| 2020 | $3,628 | $152,134 | $27,940 | $124,194 |
| 2019 | $3,548 | $143,739 | $27,940 | $115,799 |
| 2018 | $1,785 | $123,933 | $27,940 | $95,993 |
| 2017 | $2,843 | $123,933 | $27,940 | $95,993 |
| 2016 | $2,843 | $123,933 | $27,940 | $95,993 |
| 2015 | $2,515 | $123,933 | $27,940 | $95,993 |
| 2014 | $2,515 | $104,645 | $21,560 | $83,085 |
Source: Public Records
Map
Nearby Homes
- 8550 Waiting Spring Ln
- 8550 Sparkling Springs Dr
- 8426 Laurel Trails Dr
- 16123 Aberdeen Forest Dr
- 16111 Aberdeen Forest Dr
- 15954 Oak Mountain Dr
- 16211 Green Smoke Dr
- 8306 Lake Crystal Dr
- 16403 Torry View Terrace
- 8814 Sherina Park Dr
- 8526 Hot Springs Dr
- 8619 Arranmore Ln
- 8818 Apple Mill Dr
- 16335 Drystone Ln
- 16426 Torry View Terrace
- 8806 Gas Light Village Dr
- 8835 Aberdeen Park Dr
- 16410 Dawnblush Ct
- 15906 Marwick Ct
- 15735 Jamie Lee Dr
- 16127 Manor Point Dr
- 8574 Pool Creek Dr
- 16123 Manor Point Dr
- 8578 Pool Creek Dr
- 8570 Pool Creek Dr
- 16119 Manor Point Dr
- 16122 Springbank Dr
- 8566 Pool Creek Dr
- 16126 Springbank Dr
- 8562 Pool Creek Dr
- 16115 Manor Point Dr
- 16134 Manor Point Dr
- 16130 Manor Point Dr
- 16126 Manor Point Dr
- 16118 Springbank Dr
- 16122 Manor Point Dr
- 16123 Springbank Dr
- 8558 Pool Creek Dr
- 16142 Manor Point Dr
- 16118 Manor Point Dr