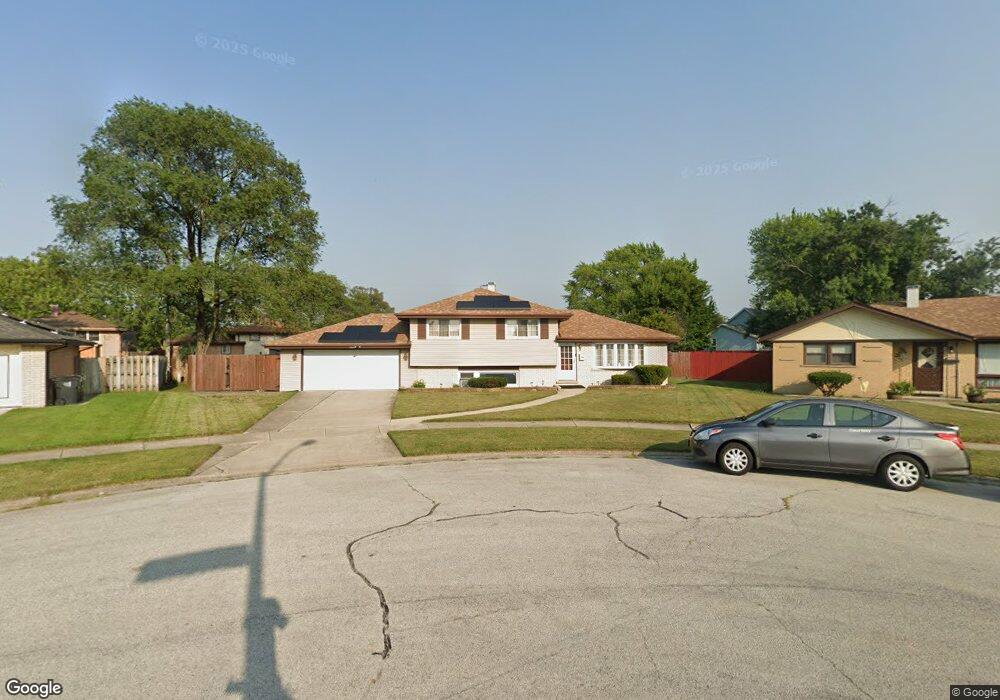
16133 Wabash Ave South Holland, IL 60473
Estimated Value: $220,610 - $241,000
3
Beds
2
Baths
1,140
Sq Ft
$200/Sq Ft
Est. Value
About This Home
This home is located at 16133 Wabash Ave, South Holland, IL 60473 and is currently estimated at $227,903, approximately $199 per square foot. 16133 Wabash Ave is a home located in Cook County with nearby schools including Taft School, Eisenhower School, and Coolidge Middle School.
Ownership History
Date
Name
Owned For
Owner Type
Purchase Details
Closed on
Nov 29, 2005
Sold by
Thompson George A
Bought by
Stovall Thurman
Current Estimated Value
Home Financials for this Owner
Home Financials are based on the most recent Mortgage that was taken out on this home.
Original Mortgage
$141,750
Interest Rate
7.62%
Mortgage Type
New Conventional
Purchase Details
Closed on
Jul 18, 2002
Sold by
Komanski Phillip E
Bought by
Thompson George A
Home Financials for this Owner
Home Financials are based on the most recent Mortgage that was taken out on this home.
Original Mortgage
$148,410
Interest Rate
6.64%
Purchase Details
Closed on
Feb 1, 1994
Sold by
Komanski Phillip E and Komanski Linda K
Bought by
Komanski Phillip E and Komanski Linda K
Home Financials for this Owner
Home Financials are based on the most recent Mortgage that was taken out on this home.
Original Mortgage
$83,000
Interest Rate
7.05%
Create a Home Valuation Report for This Property
The Home Valuation Report is an in-depth analysis detailing your home's value as well as a comparison with similar homes in the area
Home Values in the Area
Average Home Value in this Area
Purchase History
| Date | Buyer | Sale Price | Title Company |
|---|---|---|---|
| Stovall Thurman | $189,000 | Chicago Title Insurance Co | |
| Thompson George A | $153,000 | -- | |
| Komanski Phillip E | -- | -- |
Source: Public Records
Mortgage History
| Date | Status | Borrower | Loan Amount |
|---|---|---|---|
| Previous Owner | Stovall Thurman | $141,750 | |
| Previous Owner | Thompson George A | $148,410 | |
| Previous Owner | Komanski Phillip E | $83,000 |
Source: Public Records
Tax History Compared to Growth
Tax History
| Year | Tax Paid | Tax Assessment Tax Assessment Total Assessment is a certain percentage of the fair market value that is determined by local assessors to be the total taxable value of land and additions on the property. | Land | Improvement |
|---|---|---|---|---|
| 2024 | $7,788 | $20,000 | $6,280 | $13,720 |
| 2023 | $6,366 | $20,000 | $6,280 | $13,720 |
| 2022 | $6,366 | $14,041 | $5,383 | $8,658 |
| 2021 | $6,349 | $14,040 | $5,382 | $8,658 |
| 2020 | $6,108 | $14,040 | $5,382 | $8,658 |
| 2019 | $4,839 | $11,717 | $4,784 | $6,933 |
| 2018 | $4,723 | $11,717 | $4,784 | $6,933 |
| 2017 | $4,621 | $11,717 | $4,784 | $6,933 |
| 2016 | $4,704 | $11,171 | $4,485 | $6,686 |
| 2015 | $4,950 | $12,037 | $4,485 | $7,552 |
| 2014 | $4,871 | $12,037 | $4,485 | $7,552 |
| 2013 | $5,032 | $13,002 | $4,485 | $8,517 |
Source: Public Records
Map
Nearby Homes
- 16117 Wabash Ave
- 16140 Prairie Ave
- 16046 Prairie Ave
- 112 E 160th Place
- 16254 Prairie Ave
- 131 E 163rd St Unit 16A
- 15955 State St
- 16339 State St
- 45 E 159th St
- 1 E 164th St
- 16428 Wabash Ave
- 16524 Woodlawn Ave W
- 16430 S Park Ave
- 16503 Louis Ave
- 509 E 161st Place
- 519 E 161st St
- 16445 S Park Ave
- 480 E 163rd St
- 16211 Joyce Cir
- 15800 Suntone Dr
- 105 E 161st Place
- 16134 Michigan Ave
- 16125 Wabash Ave
- 16130 Michigan Ave
- 16124 Michigan Ave
- 104 E 162nd St
- 63 E 161st Place
- 64 E 162nd St
- 112 E 162nd St
- 57 E 161st Place
- 60 E 162nd St
- 16112 Michigan Ave
- 54 E 162nd St
- 16141 Michigan Ave
- 16109 Wabash Ave
- 16133 Michigan Ave
- 134 E 162nd St Unit 1
- 54 E 161st Place
- 16125 Michigan Ave