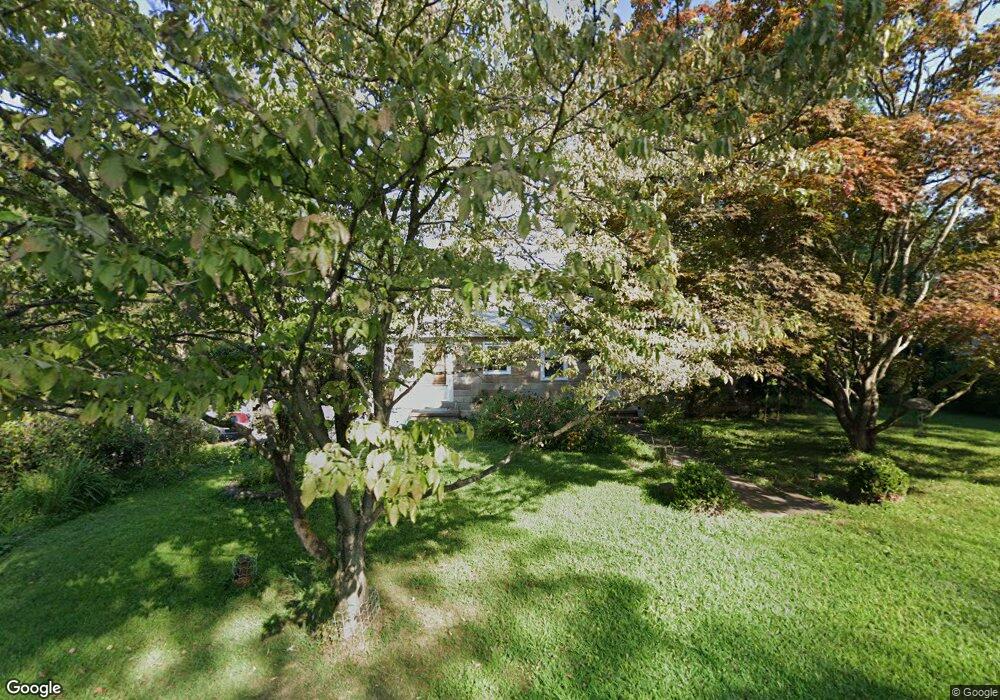
1614 Clearview Rd Lansdale, PA 19446
Estimated Value: $348,000 - $422,000
2
Beds
1
Bath
1,320
Sq Ft
$294/Sq Ft
Est. Value
About This Home
This home is located at 1614 Clearview Rd, Lansdale, PA 19446 and is currently estimated at $388,113, approximately $294 per square foot. 1614 Clearview Rd is a home located in Montgomery County with nearby schools including Gwynedd Square Elementary School, Penndale Middle School, and North Penn Senior High School.
Ownership History
Date
Name
Owned For
Owner Type
Purchase Details
Closed on
Sep 16, 2019
Sold by
Chapman Robert Ronald
Bought by
Chapman Raymond W
Current Estimated Value
Home Financials for this Owner
Home Financials are based on the most recent Mortgage that was taken out on this home.
Original Mortgage
$180,000
Outstanding Balance
$157,341
Interest Rate
3.5%
Mortgage Type
New Conventional
Estimated Equity
$230,772
Purchase Details
Closed on
Jul 19, 2019
Sold by
Chapman Raymond W
Bought by
Chapman Raymond W and Chapman Robert Ronald
Home Financials for this Owner
Home Financials are based on the most recent Mortgage that was taken out on this home.
Original Mortgage
$180,000
Outstanding Balance
$157,341
Interest Rate
3.5%
Mortgage Type
New Conventional
Estimated Equity
$230,772
Purchase Details
Closed on
Jan 1, 1962
Bought by
Chapman Robert R and Chapman Anna
Create a Home Valuation Report for This Property
The Home Valuation Report is an in-depth analysis detailing your home's value as well as a comparison with similar homes in the area
Home Values in the Area
Average Home Value in this Area
Purchase History
| Date | Buyer | Sale Price | Title Company |
|---|---|---|---|
| Chapman Raymond W | $100,000 | None Available | |
| Chapman Raymond W | -- | None Available | |
| Chapman Robert R | -- | -- |
Source: Public Records
Mortgage History
| Date | Status | Borrower | Loan Amount |
|---|---|---|---|
| Open | Chapman Raymond W | $180,000 |
Source: Public Records
Tax History Compared to Growth
Tax History
| Year | Tax Paid | Tax Assessment Tax Assessment Total Assessment is a certain percentage of the fair market value that is determined by local assessors to be the total taxable value of land and additions on the property. | Land | Improvement |
|---|---|---|---|---|
| 2025 | $4,448 | $121,250 | $47,410 | $73,840 |
| 2024 | $4,448 | $121,250 | $47,410 | $73,840 |
| 2023 | $4,240 | $121,250 | $47,410 | $73,840 |
| 2022 | $4,089 | $121,250 | $47,410 | $73,840 |
| 2021 | $3,982 | $121,250 | $47,410 | $73,840 |
| 2020 | $3,878 | $121,250 | $47,410 | $73,840 |
| 2019 | $4,235 | $121,250 | $47,410 | $73,840 |
| 2018 | $3,806 | $121,250 | $47,410 | $73,840 |
| 2017 | $3,647 | $121,250 | $47,410 | $73,840 |
| 2016 | $3,599 | $121,250 | $47,410 | $73,840 |
| 2015 | $3,437 | $121,250 | $47,410 | $73,840 |
| 2014 | $3,437 | $121,250 | $47,410 | $73,840 |
Source: Public Records
Map
Nearby Homes
- 1625 Clearbrook Rd
- 803 Poplar Ct
- 210 Berwick Place Unit 20E
- 128 Wellington Terrace
- 1116 Dogwood Ct
- 984 Independence Ln Unit 13
- 1653 Bridle Path Dr
- 937 General Nash Dr
- 1059 Charter Oaks Dr
- 1107 Jarvis Ln
- 1120 Kingsley Hall Dr
- 10 Wheatley Walk
- 1825 Flintlock Cir
- 818 Green St
- 758 Brian Way
- 750 Annes Ct
- 4 State St
- 1939 Penngrove Terrace
- 197 Eric Ln
- 830 S Broad St
- 1620 Clearview Rd
- 1612 Clearview Rd
- 1609 Clearbrook Rd
- 1611 Clearbrook Rd
- 1610 Clearview Rd
- 1616 Clearview Rd
- 1613 Clearbrook Rd
- 1607 Clearbrook Rd
- 1611 Clearview Rd
- 1608 Clearview Rd
- 1615 Clearbrook Rd
- 1609 Clearview Rd
- 1608 Clearbrook Rd
- 1606 Clearview Rd
- 1604 Clearbrook Rd
- 1619 Clearbrook Rd
- 1607 Clearview Rd
- 1606 Clearbrook Rd
- 1612 Clearbrook Rd
- 986 Sumneytown Pike