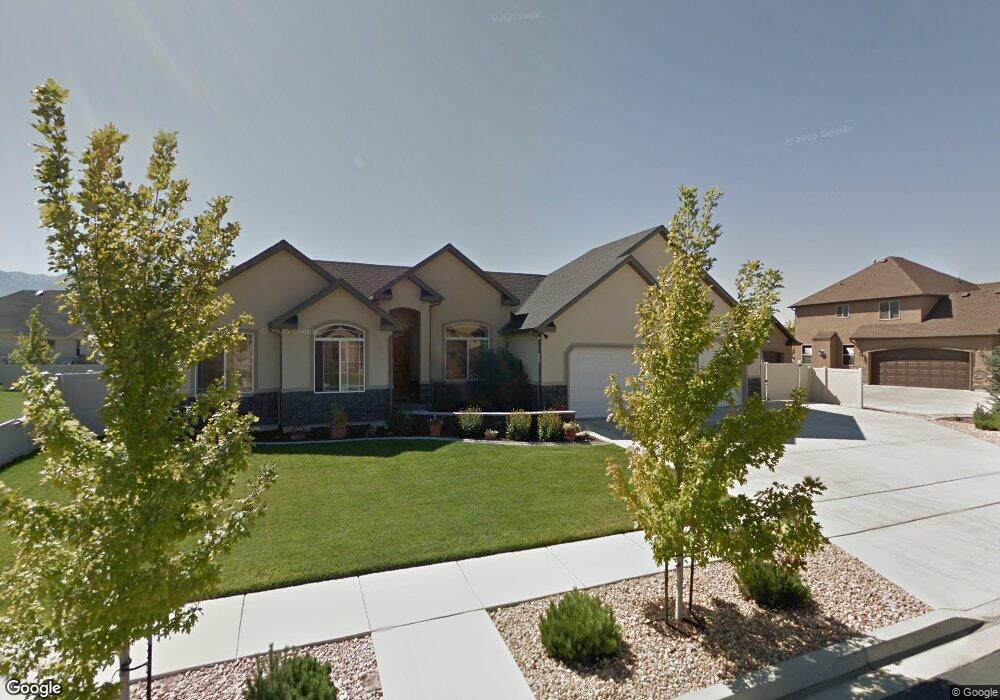
1614 E 390 N Spanish Fork, UT 84660
Estimated Value: $607,000 - $693,000
6
Beds
3
Baths
2,935
Sq Ft
$219/Sq Ft
Est. Value
About This Home
This home is located at 1614 E 390 N, Spanish Fork, UT 84660 and is currently estimated at $642,100, approximately $218 per square foot. 1614 E 390 N is a home located in Utah County with nearby schools including Sierra Bonita Elementary School, Mapleton Junior High School, and Maple Mountain High School.
Ownership History
Date
Name
Owned For
Owner Type
Purchase Details
Closed on
Jun 17, 2016
Sold by
Johnson Gary L and Johnson Deborah B
Bought by
Johnson Gary L and Johnson Deborah B
Current Estimated Value
Purchase Details
Closed on
May 25, 2010
Sold by
Ridges Jared R
Bought by
Johnson Gary L and Johnson Deborah B
Home Financials for this Owner
Home Financials are based on the most recent Mortgage that was taken out on this home.
Original Mortgage
$176,000
Outstanding Balance
$117,850
Interest Rate
5.03%
Mortgage Type
New Conventional
Estimated Equity
$524,250
Purchase Details
Closed on
Feb 20, 2007
Sold by
Envision Development Llc
Bought by
Ridges Jared R
Home Financials for this Owner
Home Financials are based on the most recent Mortgage that was taken out on this home.
Original Mortgage
$63,000
Interest Rate
6.29%
Mortgage Type
Stand Alone Second
Create a Home Valuation Report for This Property
The Home Valuation Report is an in-depth analysis detailing your home's value as well as a comparison with similar homes in the area
Home Values in the Area
Average Home Value in this Area
Purchase History
| Date | Buyer | Sale Price | Title Company |
|---|---|---|---|
| Johnson Gary L | -- | None Available | |
| Johnson Gary L | -- | Old Republic Title Company | |
| Ridges Jared R | -- | Title West Title Company |
Source: Public Records
Mortgage History
| Date | Status | Borrower | Loan Amount |
|---|---|---|---|
| Open | Johnson Gary L | $176,000 | |
| Previous Owner | Ridges Jared R | $63,000 | |
| Previous Owner | Ridges Jared R | $252,000 |
Source: Public Records
Tax History
| Year | Tax Paid | Tax Assessment Tax Assessment Total Assessment is a certain percentage of the fair market value that is determined by local assessors to be the total taxable value of land and additions on the property. | Land | Improvement |
|---|---|---|---|---|
| 2025 | $2,916 | $336,820 | -- | -- |
| 2024 | $2,916 | $300,575 | $0 | $0 |
| 2023 | $2,974 | $306,845 | $0 | $0 |
| 2022 | $2,938 | $297,330 | $0 | $0 |
| 2021 | $2,477 | $401,000 | $145,000 | $256,000 |
| 2020 | $2,302 | $362,400 | $131,800 | $230,600 |
| 2019 | $2,106 | $348,700 | $123,600 | $225,100 |
| 2018 | $2,089 | $334,400 | $113,000 | $221,400 |
| 2017 | $2,050 | $176,385 | $0 | $0 |
| 2016 | $1,840 | $156,200 | $0 | $0 |
| 2015 | $1,840 | $154,330 | $0 | $0 |
| 2014 | $1,768 | $148,830 | $0 | $0 |
Source: Public Records
Map
Nearby Homes
- 1495 E 400 N
- 1005 E 260 N Unit 20
- 2672 E 360 N Unit MRVL09
- 1022 E 360 N Unit 27
- 991 E 360 N Unit 8
- 1455 E 100 S
- 1261 E 680 N
- 1238 E 680 N
- 708 N Black Horse Loop Unit 708
- 1108 E 260 N
- 2137 E 200 N Unit MSF53
- 2138 E 200 N Unit MSF54
- 2163 E 200 N Unit MSF52
- 998 E 260 N Unit 16
- 992 E 260 N Unit 15
- 663 N 2040 E
- 136 N 1120 E
- 2117 E 130 N Unit 59
- 306 N 1070 E
- 306 N 1070 E Unit 17
Your Personal Tour Guide
Ask me questions while you tour the home.