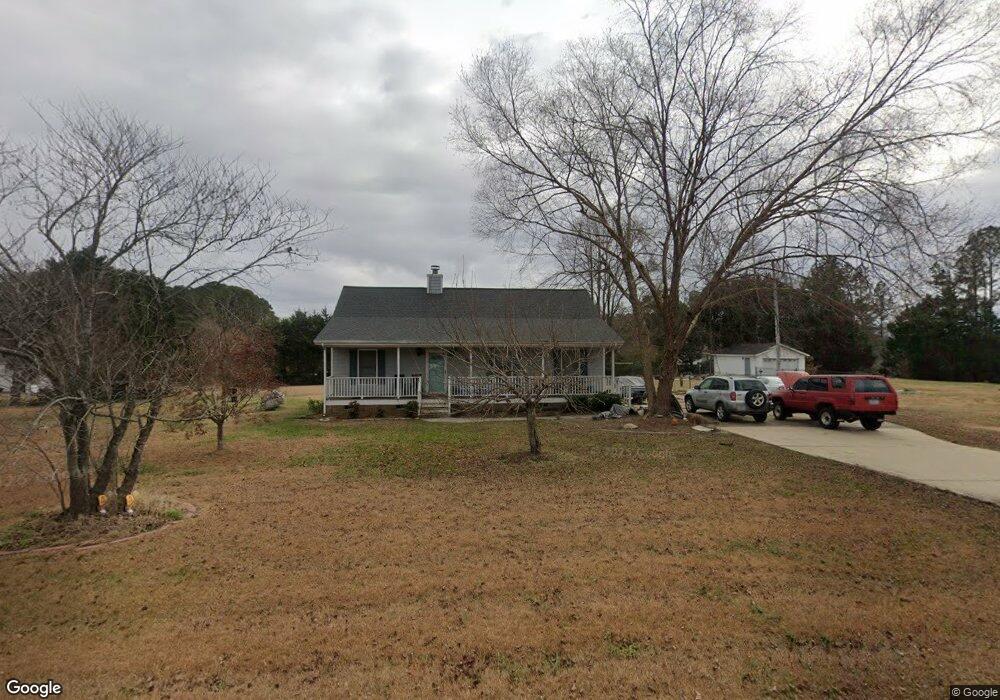
1614 Mudham Rd Zebulon, NC 27597
Estimated Value: $293,000 - $313,000
3
Beds
2
Baths
1,281
Sq Ft
$239/Sq Ft
Est. Value
About This Home
This home is located at 1614 Mudham Rd, Zebulon, NC 27597 and is currently estimated at $305,662, approximately $238 per square foot. 1614 Mudham Rd is a home located in Johnston County with nearby schools including Corinth Holders Elementary School, Archer Lodge Middle School, and Corinth Holders High School.
Ownership History
Date
Name
Owned For
Owner Type
Purchase Details
Closed on
May 24, 2019
Sold by
Ribbon Home Spy 1 Llc
Bought by
Bayley Charles T
Current Estimated Value
Home Financials for this Owner
Home Financials are based on the most recent Mortgage that was taken out on this home.
Original Mortgage
$179,353
Outstanding Balance
$157,367
Interest Rate
4.1%
Mortgage Type
New Conventional
Estimated Equity
$148,295
Purchase Details
Closed on
Jan 18, 2019
Sold by
Triangle Homes And Rehab Inc
Bought by
Ribbon Home Spv I Llc
Purchase Details
Closed on
Nov 1, 2018
Sold by
Weathers Bob Alexander and Weathers Sheri
Bought by
Triangle Homes And Rehab Inc
Home Financials for this Owner
Home Financials are based on the most recent Mortgage that was taken out on this home.
Original Mortgage
$135,185
Interest Rate
4.6%
Mortgage Type
Purchase Money Mortgage
Purchase Details
Closed on
Aug 31, 2005
Sold by
Fryett Jeremy E and Fryett Tammy P
Bought by
Weathers Mary W
Create a Home Valuation Report for This Property
The Home Valuation Report is an in-depth analysis detailing your home's value as well as a comparison with similar homes in the area
Home Values in the Area
Average Home Value in this Area
Purchase History
| Date | Buyer | Sale Price | Title Company |
|---|---|---|---|
| Bayley Charles T | $185,000 | None Available | |
| Ribbon Home Spv I Llc | $185,000 | None Available | |
| Triangle Homes And Rehab Inc | $125,000 | None Available | |
| Weathers Mary W | $125,000 | None Available |
Source: Public Records
Mortgage History
| Date | Status | Borrower | Loan Amount |
|---|---|---|---|
| Open | Bayley Charles T | $179,353 | |
| Previous Owner | Triangle Homes And Rehab Inc | $135,185 |
Source: Public Records
Tax History
| Year | Tax Paid | Tax Assessment Tax Assessment Total Assessment is a certain percentage of the fair market value that is determined by local assessors to be the total taxable value of land and additions on the property. | Land | Improvement |
|---|---|---|---|---|
| 2025 | $1,752 | $275,960 | $61,920 | $214,040 |
| 2024 | $1,256 | $155,070 | $29,720 | $125,350 |
| 2023 | $1,241 | $155,070 | $29,720 | $125,350 |
| 2022 | $1,303 | $155,070 | $29,720 | $125,350 |
| 2021 | $1,303 | $155,070 | $29,720 | $125,350 |
| 2020 | $1,334 | $155,070 | $29,720 | $125,350 |
| 2019 | $1,334 | $155,070 | $29,720 | $125,350 |
| 2018 | $1,043 | $118,500 | $27,250 | $91,250 |
| 2017 | $1,043 | $118,500 | $27,250 | $91,250 |
| 2016 | $1,043 | $118,500 | $27,250 | $91,250 |
| 2015 | $834 | $118,500 | $27,250 | $91,250 |
| 2014 | $626 | $118,500 | $27,250 | $91,250 |
Source: Public Records
Map
Nearby Homes
- 51 Golden Eagle Ridge
- 93 Eagle Swoop St
- 295 Springtooth Dr
- 409 Springtooth Dr
- 429 Springtooth Dr
- 451 Springtooth Dr
- 492 Springtooth Dr
- 422 Rye Way
- 517 Springtooth Dr
- 510 Springtooth Dr
- 502 Rye Way
- 528 Rye Way
- 532 Springtooth Dr
- 74 Henhouse Ct
- 550 Springtooth Dr
- 570 Springtooth Dr
- 102 Andrews Landing Dr
- 628 Springtooth Dr
- 67 Rice Rd
- 63 Rice Rd
- 2312 Earpsboro Rd
- 1616 Mudham Rd
- 1633 Mudham Rd
- 1617 Mudham Rd
- 1651 Mudham Rd
- 1669 Mudham Rd
- 15313 Nc 96 Hwy N
- 1670 Mudham Rd
- 2196 Earpsboro Rd
- 2330 Earpsboro Rd
- 2340 Earpsboro Rd
- 1695 Mudham Rd
- 15354 Nc 96 Hwy N
- 2366 Earpsboro Rd
- 15428 Nc 96 Hwy N Unit N
- 15338 Nc 96 Hwy N
- 2399 Earpsboro Rd
- 2392 Earpsboro Rd
- 15330 Nc 96 Hwy N
- 2169 Earpsboro Rd
Your Personal Tour Guide
Ask me questions while you tour the home.