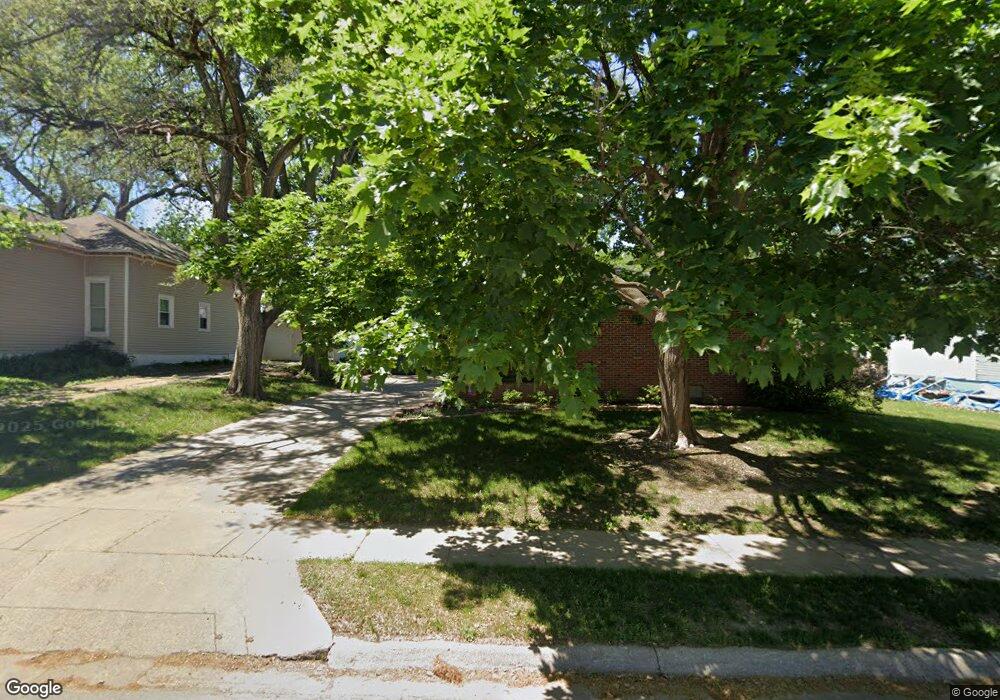
1614 N 31st St Lincoln, NE 68503
Clinton NeighborhoodEstimated Value: $179,251 - $200,000
3
Beds
1
Bath
1,146
Sq Ft
$163/Sq Ft
Est. Value
About This Home
This home is located at 1614 N 31st St, Lincoln, NE 68503 and is currently estimated at $186,563, approximately $162 per square foot. 1614 N 31st St is a home located in Lancaster County with nearby schools including Clinton Elementary School, C. Culler Middle School, and Lincoln Northeast High School.
Ownership History
Date
Name
Owned For
Owner Type
Purchase Details
Closed on
Feb 1, 2024
Sold by
Jiskra Linda M and Jiskra Daniel
Bought by
Lh West Lincoln Llc
Current Estimated Value
Purchase Details
Closed on
Jun 26, 2003
Sold by
Knapp Patricia A
Bought by
Jiskra Linda M
Home Financials for this Owner
Home Financials are based on the most recent Mortgage that was taken out on this home.
Original Mortgage
$91,600
Interest Rate
5.27%
Mortgage Type
FHA
Create a Home Valuation Report for This Property
The Home Valuation Report is an in-depth analysis detailing your home's value as well as a comparison with similar homes in the area
Home Values in the Area
Average Home Value in this Area
Purchase History
| Date | Buyer | Sale Price | Title Company |
|---|---|---|---|
| Lh West Lincoln Llc | -- | None Listed On Document | |
| Jiskra Linda M | $93,000 | -- |
Source: Public Records
Mortgage History
| Date | Status | Borrower | Loan Amount |
|---|---|---|---|
| Previous Owner | Jiskra Linda M | $91,600 |
Source: Public Records
Tax History Compared to Growth
Tax History
| Year | Tax Paid | Tax Assessment Tax Assessment Total Assessment is a certain percentage of the fair market value that is determined by local assessors to be the total taxable value of land and additions on the property. | Land | Improvement |
|---|---|---|---|---|
| 2025 | $2,200 | $172,600 | $37,000 | $135,600 |
| 2024 | $2,200 | $157,100 | $30,000 | $127,100 |
| 2023 | $2,449 | $146,100 | $30,000 | $116,100 |
| 2022 | $2,539 | $127,400 | $25,000 | $102,400 |
| 2021 | $2,402 | $127,400 | $25,000 | $102,400 |
| 2020 | $2,031 | $106,300 | $25,000 | $81,300 |
| 2019 | $2,031 | $106,300 | $25,000 | $81,300 |
| 2018 | $2,008 | $104,600 | $25,000 | $79,600 |
| 2017 | $2,026 | $104,600 | $25,000 | $79,600 |
| 2016 | $1,786 | $91,700 | $25,000 | $66,700 |
| 2015 | $1,773 | $91,700 | $25,000 | $66,700 |
| 2014 | $1,809 | $93,000 | $25,000 | $68,000 |
| 2013 | -- | $93,000 | $25,000 | $68,000 |
Source: Public Records
Map
Nearby Homes