1614 Thunderbird Ln Unit 72 Dayton, OH 45449
Estimated Value: $131,000 - $148,000
3
Beds
2
Baths
1,603
Sq Ft
$89/Sq Ft
Est. Value
About This Home
This home is located at 1614 Thunderbird Ln Unit 72, Dayton, OH 45449 and is currently estimated at $142,905, approximately $89 per square foot. 1614 Thunderbird Ln Unit 72 is a home located in Montgomery County with nearby schools including West Carrollton High School and Bethel Baptist School.
Ownership History
Date
Name
Owned For
Owner Type
Purchase Details
Closed on
Feb 7, 2017
Sold by
Fifth Third Mortgage Co
Bought by
Price Lori C
Current Estimated Value
Home Financials for this Owner
Home Financials are based on the most recent Mortgage that was taken out on this home.
Original Mortgage
$58,814
Outstanding Balance
$50,364
Interest Rate
5.5%
Mortgage Type
FHA
Estimated Equity
$92,541
Purchase Details
Closed on
Jun 3, 2016
Sold by
Samlick Sharon C
Bought by
Fifth Third Mortgage Co
Purchase Details
Closed on
Mar 24, 2007
Sold by
Jones Anthony C and Jones Martina
Bought by
Samlick Sharon C
Home Financials for this Owner
Home Financials are based on the most recent Mortgage that was taken out on this home.
Original Mortgage
$94,960
Interest Rate
6.2%
Mortgage Type
Purchase Money Mortgage
Purchase Details
Closed on
Feb 21, 1997
Sold by
Warlaumont Gary
Bought by
Jones Patricia R and Jones Anthony C
Create a Home Valuation Report for This Property
The Home Valuation Report is an in-depth analysis detailing your home's value as well as a comparison with similar homes in the area
Home Values in the Area
Average Home Value in this Area
Purchase History
| Date | Buyer | Sale Price | Title Company |
|---|---|---|---|
| Price Lori C | $59,900 | Servicelink Llc | |
| Fifth Third Mortgage Co | $47,000 | None Available | |
| Samlick Sharon C | $95,000 | Attorney | |
| Jones Patricia R | $72,000 | -- |
Source: Public Records
Mortgage History
| Date | Status | Borrower | Loan Amount |
|---|---|---|---|
| Open | Price Lori C | $58,814 | |
| Previous Owner | Samlick Sharon C | $94,960 |
Source: Public Records
Tax History Compared to Growth
Tax History
| Year | Tax Paid | Tax Assessment Tax Assessment Total Assessment is a certain percentage of the fair market value that is determined by local assessors to be the total taxable value of land and additions on the property. | Land | Improvement |
|---|---|---|---|---|
| 2024 | $2,157 | $34,730 | $4,090 | $30,640 |
| 2023 | $2,157 | $34,730 | $4,090 | $30,640 |
| 2022 | $2,162 | $27,380 | $3,220 | $24,160 |
| 2021 | $2,166 | $27,380 | $3,220 | $24,160 |
| 2020 | $2,165 | $27,380 | $3,220 | $24,160 |
| 2019 | $1,803 | $20,960 | $2,800 | $18,160 |
| 2018 | $1,690 | $20,960 | $2,800 | $18,160 |
| 2017 | $1,639 | $20,960 | $2,800 | $18,160 |
| 2016 | $1,922 | $24,090 | $2,800 | $21,290 |
| 2015 | $1,764 | $24,090 | $2,800 | $21,290 |
| 2014 | $1,764 | $24,090 | $2,800 | $21,290 |
| 2012 | -- | $26,730 | $5,600 | $21,130 |
Source: Public Records
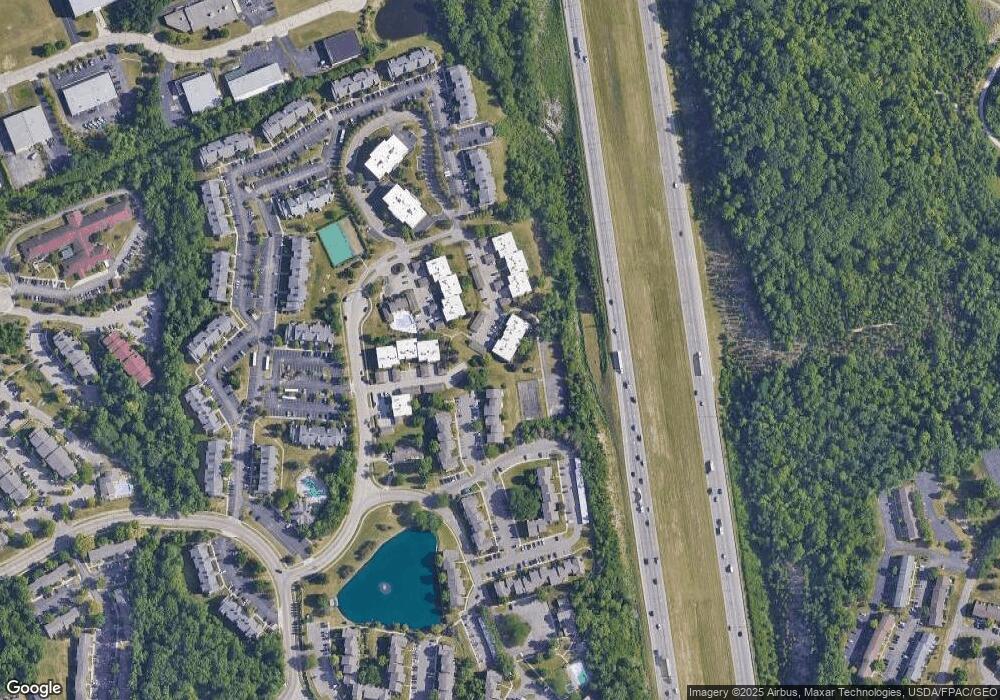
Map
Nearby Homes
- 1109 Arrowhead Crossing Unit A
- 1606 Pine Tree Ln Unit 38
- 1112 Eagle Feather Cir Unit A
- 1104 Arrowhead Crossing Unit B
- 1116 Eagle Feather Cir Unit E
- 1016 Hidden Landing Trail Unit F
- 1788 Cherokee Dr Unit F
- 1792 Cherokee Dr Unit A
- 6484 Quintessa Ct Unit 29
- 3324 Ultimate Way Unit 36
- 3316 Vanquil Trail Unit 387
- 6409 Interlude Ln Unit 415
- 3304 Ultimate Way Unit 399
- 3218 Gambit Square Unit 471
- 3254 Gambit Square Unit 451
- 6407 Kindred Square Unit 9-4
- 7153 Springboro Pike Unit A
- 3034 Bright Bounty Ln Unit 29
- 430 Donington Dr
- 609 Kings Cross Ct
- 1614 Thunderbird Ln Unit 672
- 1614 Thunderbird Ln Unit 671
- 1614 Thunderbird Ln Unit 670
- 1614 Thunderbird Ln Unit 669
- 1614 Thunderbird Ln Unit 668
- 1614 Thunderbird Ln Unit 667
- 1614 Thunderbird Ln Unit 67
- 1614 Thunderbird Ln
- 1614 Thunderbird Ln Unit 71
- 1614 Thunderbird Ln Unit 69
- 1614 Thunderbird Ln Unit 68
- 1610 Thunderbird Ln Unit 64
- 1610 Thunderbird Ln Unit 666
- 1610 Thunderbird Ln Unit 665
- 1610 Thunderbird Ln Unit 664
- 1610 Thunderbird Ln Unit 663
- 1610 Thunderbird Ln Unit 662
- 1610 Thunderbird Ln Unit 661
- 1610 Thunderbird Ln Unit 66
- 1610 Thunderbird Ln Unit 65