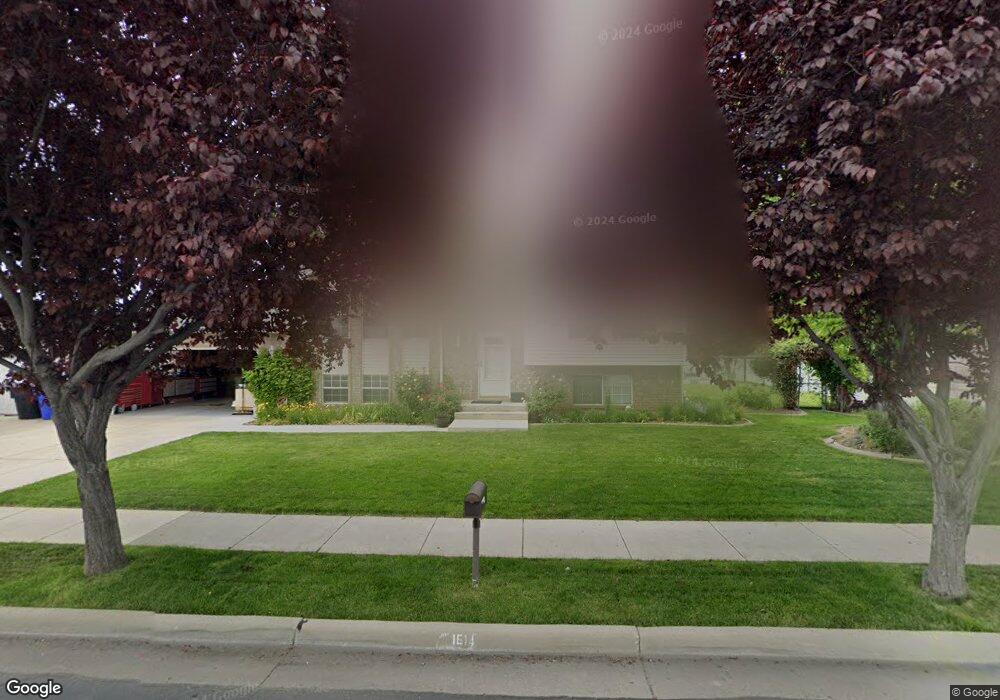
1614 W 25 N Clearfield, UT 84015
Estimated Value: $436,213 - $464,000
4
Beds
2
Baths
2,110
Sq Ft
$214/Sq Ft
Est. Value
About This Home
This home is located at 1614 W 25 N, Clearfield, UT 84015 and is currently estimated at $451,303, approximately $213 per square foot. 1614 W 25 N is a home located in Davis County with nearby schools including Lakeside School, West Point Junior High School, and Syracuse High School.
Ownership History
Date
Name
Owned For
Owner Type
Purchase Details
Closed on
Jun 22, 2004
Sold by
Thames Vicki
Bought by
Babin Chris M and Babin Wilma I
Current Estimated Value
Home Financials for this Owner
Home Financials are based on the most recent Mortgage that was taken out on this home.
Original Mortgage
$147,168
Outstanding Balance
$73,336
Interest Rate
6.29%
Mortgage Type
VA
Estimated Equity
$377,967
Purchase Details
Closed on
Oct 24, 2002
Sold by
Thames Troy O and Thames Vicki R
Bought by
Thames Vicki
Home Financials for this Owner
Home Financials are based on the most recent Mortgage that was taken out on this home.
Original Mortgage
$111,300
Interest Rate
6.09%
Purchase Details
Closed on
Mar 22, 1996
Sold by
Thames Troy O and Thames Troy O
Bought by
Thames Troy O and Thames Vicki R
Home Financials for this Owner
Home Financials are based on the most recent Mortgage that was taken out on this home.
Original Mortgage
$104,000
Interest Rate
6.98%
Create a Home Valuation Report for This Property
The Home Valuation Report is an in-depth analysis detailing your home's value as well as a comparison with similar homes in the area
Home Values in the Area
Average Home Value in this Area
Purchase History
| Date | Buyer | Sale Price | Title Company |
|---|---|---|---|
| Babin Chris M | -- | First American Title Co | |
| Thames Vicki | -- | Inwest Title Services Inc | |
| Thames Troy O | -- | First American Title Co |
Source: Public Records
Mortgage History
| Date | Status | Borrower | Loan Amount |
|---|---|---|---|
| Open | Babin Chris M | $147,168 | |
| Previous Owner | Thames Vicki | $111,300 | |
| Previous Owner | Thames Troy O | $104,000 |
Source: Public Records
Tax History Compared to Growth
Tax History
| Year | Tax Paid | Tax Assessment Tax Assessment Total Assessment is a certain percentage of the fair market value that is determined by local assessors to be the total taxable value of land and additions on the property. | Land | Improvement |
|---|---|---|---|---|
| 2025 | $259 | $233,200 | $96,742 | $136,458 |
| 2024 | $259 | $226,599 | $87,147 | $139,452 |
| 2023 | $192 | $210,100 | $58,065 | $152,034 |
| 2022 | $1,169 | $408,000 | $98,331 | $309,669 |
| 2021 | $716 | $302,000 | $87,769 | $214,231 |
| 2020 | $446 | $260,000 | $73,129 | $186,871 |
| 2019 | $377 | $246,000 | $71,129 | $174,871 |
| 2018 | $218 | $219,000 | $72,469 | $146,531 |
| 2016 | $1,375 | $98,395 | $27,981 | $70,414 |
| 2015 | $1,330 | $90,200 | $27,981 | $62,219 |
| 2014 | $1,327 | $91,219 | $27,981 | $63,238 |
| 2013 | $1,137 | $74,185 | $25,540 | $48,645 |
Source: Public Records
Map
Nearby Homes
- 47 N 1750 W
- 1648 W 150 S
- 135 S 1525 W
- 1828 W 75 S
- 16 N 1300 W
- 12 N 2000 W Unit 1
- 1774 W 400 N
- 575 N 1350 W Unit 137
- 1652 W 560 N
- 1350 W 300 N Unit 49
- 1350 W 300 N Unit 38
- 1350 W 300 N Unit 29
- 423 N 1250 W Unit 118
- 1337 W 550 N Unit 195
- 563 N 1350 W Unit 139
- 417 N 1200 W Unit 84
- 4284 W 350 S Unit 615
- 4296 W 350 S Unit 614
- 1805 W 675 N
- 607 N 2000 W