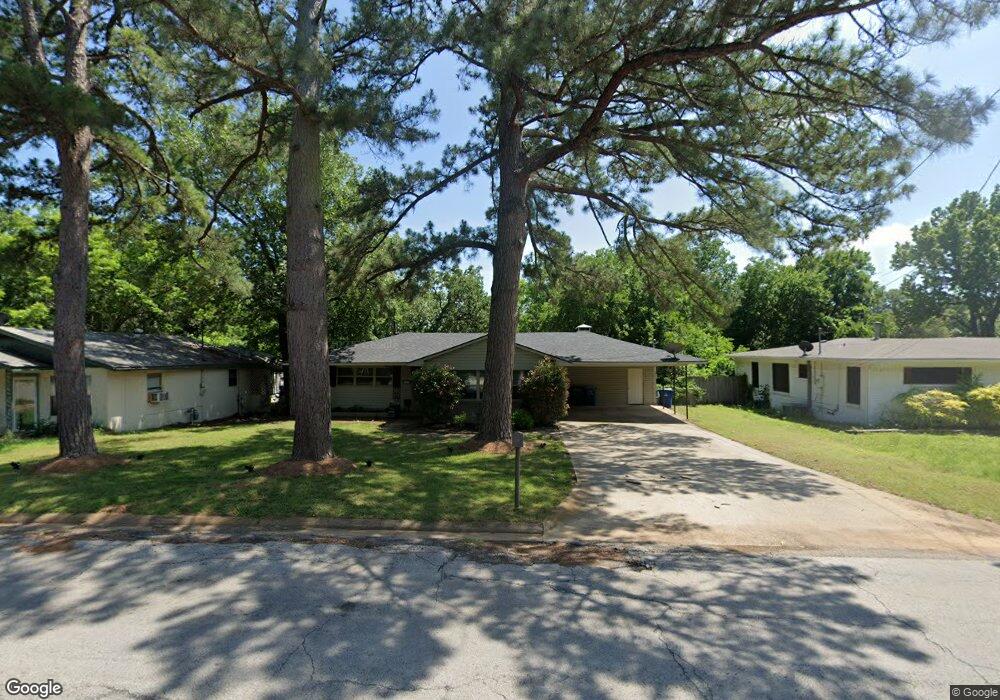
1614 W Hull St Denison, TX 75020
Estimated Value: $201,058 - $252,000
3
Beds
2
Baths
1,846
Sq Ft
$123/Sq Ft
Est. Value
About This Home
This home is located at 1614 W Hull St, Denison, TX 75020 and is currently estimated at $226,529, approximately $122 per square foot. 1614 W Hull St is a home located in Grayson County with nearby schools including Houston Elementary School, Scott Middle School, and Denison High School.
Ownership History
Date
Name
Owned For
Owner Type
Purchase Details
Closed on
Mar 14, 2019
Sold by
Lessly Frederick and Lessly Twila
Bought by
Fortner Five Llc
Current Estimated Value
Purchase Details
Closed on
Aug 23, 2006
Sold by
Avila Steven R and Avila Staci D
Bought by
Lessly Frederick
Home Financials for this Owner
Home Financials are based on the most recent Mortgage that was taken out on this home.
Original Mortgage
$79,600
Interest Rate
6.75%
Mortgage Type
Purchase Money Mortgage
Purchase Details
Closed on
Dec 22, 2005
Sold by
Arnold Noel E and Arnold Margaret A
Bought by
Avila Steven R and Avila Staci D
Home Financials for this Owner
Home Financials are based on the most recent Mortgage that was taken out on this home.
Original Mortgage
$60,000
Interest Rate
6.3%
Mortgage Type
Purchase Money Mortgage
Create a Home Valuation Report for This Property
The Home Valuation Report is an in-depth analysis detailing your home's value as well as a comparison with similar homes in the area
Home Values in the Area
Average Home Value in this Area
Purchase History
| Date | Buyer | Sale Price | Title Company |
|---|---|---|---|
| Fortner Five Llc | -- | None Available | |
| Lessly Frederick | -- | None Available | |
| Avila Steven R | -- | None Available |
Source: Public Records
Mortgage History
| Date | Status | Borrower | Loan Amount |
|---|---|---|---|
| Previous Owner | Lessly Frederick | $79,600 | |
| Previous Owner | Avila Steven R | $60,000 |
Source: Public Records
Tax History Compared to Growth
Tax History
| Year | Tax Paid | Tax Assessment Tax Assessment Total Assessment is a certain percentage of the fair market value that is determined by local assessors to be the total taxable value of land and additions on the property. | Land | Improvement |
|---|---|---|---|---|
| 2025 | $3,921 | $167,035 | $45,900 | $121,135 |
| 2024 | $3,921 | $168,780 | $45,000 | $123,780 |
| 2023 | $3,820 | $168,597 | $34,425 | $134,172 |
| 2022 | $3,623 | $152,473 | $29,138 | $123,335 |
| 2021 | $3,009 | $119,292 | $21,488 | $97,804 |
| 2020 | $3,090 | $117,162 | $21,488 | $95,674 |
| 2019 | $3,296 | $119,790 | $21,488 | $98,302 |
| 2018 | $3,026 | $109,081 | $16,875 | $92,206 |
| 2017 | $2,934 | $104,884 | $13,275 | $91,609 |
| 2016 | $2,746 | $98,140 | $10,350 | $87,790 |
| 2015 | $1,409 | $89,414 | $10,350 | $79,064 |
| 2014 | $1,554 | $85,897 | $10,350 | $75,547 |
Source: Public Records
Map
Nearby Homes
- 1730 W Hull St
- 901 Old State Ln
- 1510 W Heron St
- 1508 W Shepherd St
- 1105 Woodlawn Blvd
- 1315 W Hull St
- 12 Ambassador Ct
- 612 Ambassador St
- 600 Ambassador St
- 1224 W Nelson St
- 501 S Eddy Ave
- 1319 W Morgan St
- 1217 W Nelson St
- 1131 W Shepherd St
- 931 Waterloo Lake Dr
- 901 Waterloo Lake Dr
- 1731 W Crawford St
- 1326 W Crawford St
- 0 S Maurice Ave
- TBD W Crawford St
- 1610 W Hull St
- 1620 W Hull St
- 1604 W Hull St
- 1600 W Hull St
- 1630 W Hull St
- 1021 S Fairbanks Ave
- 1012 S French Ave
- 1030 S French Ave
- 1530 W Hull St
- 911 S Fairbanks Ave
- 1531 W Texas St
- 930 S French Ave
- 1700 W Hull St
- 1011 S French Ave
- 1526 W Hull St
- 1021 S French Ave
- 920 S Fairbanks Ave
- 1525 W Texas St
- 1101 S Fairbanks Ave
- 1029 S French Ave