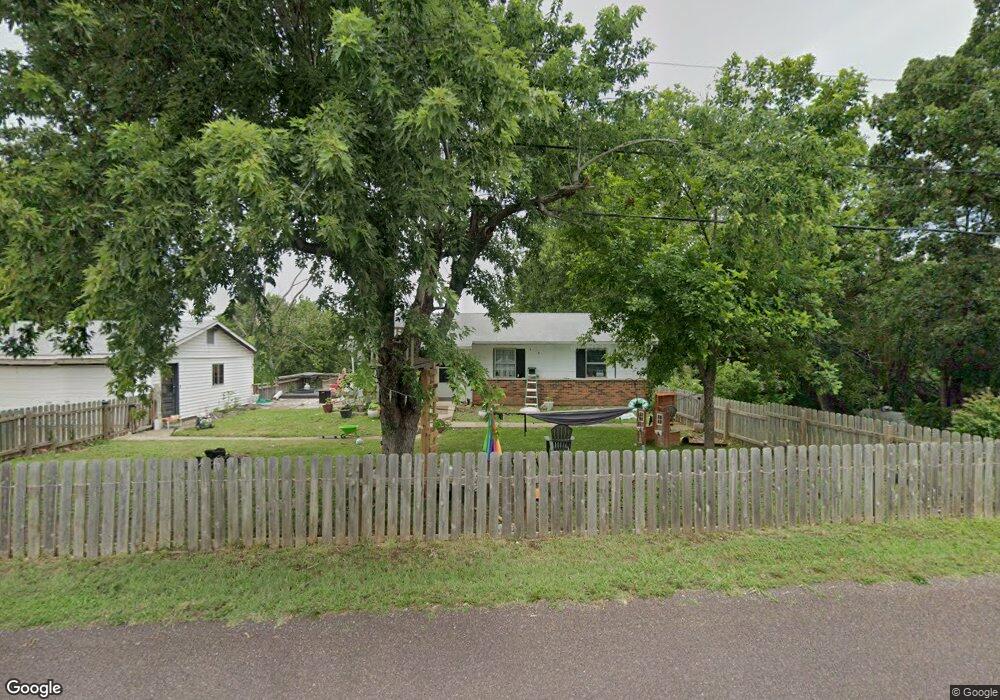
1615 Berry Dairy Rd de Soto, MO 63020
Estimated Value: $160,233 - $211,000
--
Bed
--
Bath
960
Sq Ft
$189/Sq Ft
Est. Value
About This Home
This home is located at 1615 Berry Dairy Rd, de Soto, MO 63020 and is currently estimated at $181,558, approximately $189 per square foot. 1615 Berry Dairy Rd is a home located in Jefferson County with nearby schools including Sunrise Elementary School and St Rose Of Lima School.
Ownership History
Date
Name
Owned For
Owner Type
Purchase Details
Closed on
Jan 9, 2020
Sold by
Showcase Properties Llc
Bought by
Adkins Paul and Adkins Sarah
Current Estimated Value
Home Financials for this Owner
Home Financials are based on the most recent Mortgage that was taken out on this home.
Original Mortgage
$84,848
Outstanding Balance
$74,967
Interest Rate
3.6%
Mortgage Type
New Conventional
Estimated Equity
$106,591
Purchase Details
Closed on
Jun 26, 2019
Sold by
Broeker Marjorie and Broeker William L
Bought by
Showcase Properties Llc
Purchase Details
Closed on
May 5, 2004
Sold by
Freeland Lyle E and Freeland Nellie M
Bought by
Dierks Jeremy and Dierks Angel
Home Financials for this Owner
Home Financials are based on the most recent Mortgage that was taken out on this home.
Original Mortgage
$32,000
Interest Rate
5.53%
Mortgage Type
Seller Take Back
Create a Home Valuation Report for This Property
The Home Valuation Report is an in-depth analysis detailing your home's value as well as a comparison with similar homes in the area
Home Values in the Area
Average Home Value in this Area
Purchase History
| Date | Buyer | Sale Price | Title Company |
|---|---|---|---|
| Adkins Paul | -- | Continental Title Company | |
| Showcase Properties Llc | -- | Hillsborough Title | |
| Dierks Jeremy | -- | -- |
Source: Public Records
Mortgage History
| Date | Status | Borrower | Loan Amount |
|---|---|---|---|
| Open | Adkins Paul | $84,848 | |
| Previous Owner | Dierks Jeremy | $32,000 |
Source: Public Records
Tax History Compared to Growth
Tax History
| Year | Tax Paid | Tax Assessment Tax Assessment Total Assessment is a certain percentage of the fair market value that is determined by local assessors to be the total taxable value of land and additions on the property. | Land | Improvement |
|---|---|---|---|---|
| 2025 | $1,057 | $15,900 | $1,100 | $14,800 |
| 2024 | $1,057 | $14,700 | $1,100 | $13,600 |
| 2023 | $1,057 | $14,700 | $1,100 | $13,600 |
| 2022 | $1,039 | $14,700 | $1,100 | $13,600 |
| 2021 | $1,039 | $14,700 | $1,100 | $13,600 |
| 2020 | $954 | $13,200 | $900 | $12,300 |
| 2019 | $954 | $13,200 | $900 | $12,300 |
| 2018 | $947 | $13,200 | $900 | $12,300 |
| 2017 | $907 | $13,200 | $900 | $12,300 |
| 2016 | $855 | $12,200 | $900 | $11,300 |
| 2015 | $789 | $12,200 | $900 | $11,300 |
| 2013 | -- | $11,600 | $800 | $10,800 |
Source: Public Records
Map
Nearby Homes
- 1571 Berry Dairy Rd
- BLOCK 54 Highway E
- 54 Veterans Dr
- 0 Cedar Tree Ln
- 4445 Cedar Tree Ln
- 400 E Plattin St
- 52 Highway E (Veterans Dr ) Hwy
- 53 HIGHWAY E (Vererans Dr) Dr
- 0 Kennett St
- 100 Kennett St
- 10 Acres Off Hawkwood Trail
- 0 Hwy E-Veterans Hwy Unit MIS25014230
- 0 Vineland School Rd
- 663 Boyne St
- 623 Boyne St
- 708 S 2nd St
- 614 W Saint Louis St
- 221 W Miller St
- 716 W Saint Louis St
- 424 S 2nd St
- 1625 Berry Dairy Rd
- 1622 Berry Dairy Rd
- 1607 Berry Dairy Rd
- 1628 Berry Dairy Rd
- 1627 Berry Dairy Rd
- 1597 Berry Dairy Rd
- 1534 Delaine Ave
- 1538 Delaine Ave
- 1633 Berry Dairy Rd
- 1598 Berry Dairy Rd
- 1542 Delaine Ave
- 1530 Delaine Ave
- 1546 Delaine Ave
- 1526 Delaine Ave
- 1591 Berry Dairy Rd
- 1550 Delaine Ave
- 1590 Berry Dairy Rd
- 1640 Berry Dairy Rd
- 1522 Delaine Ave
- 216 Patricia Lee Dr