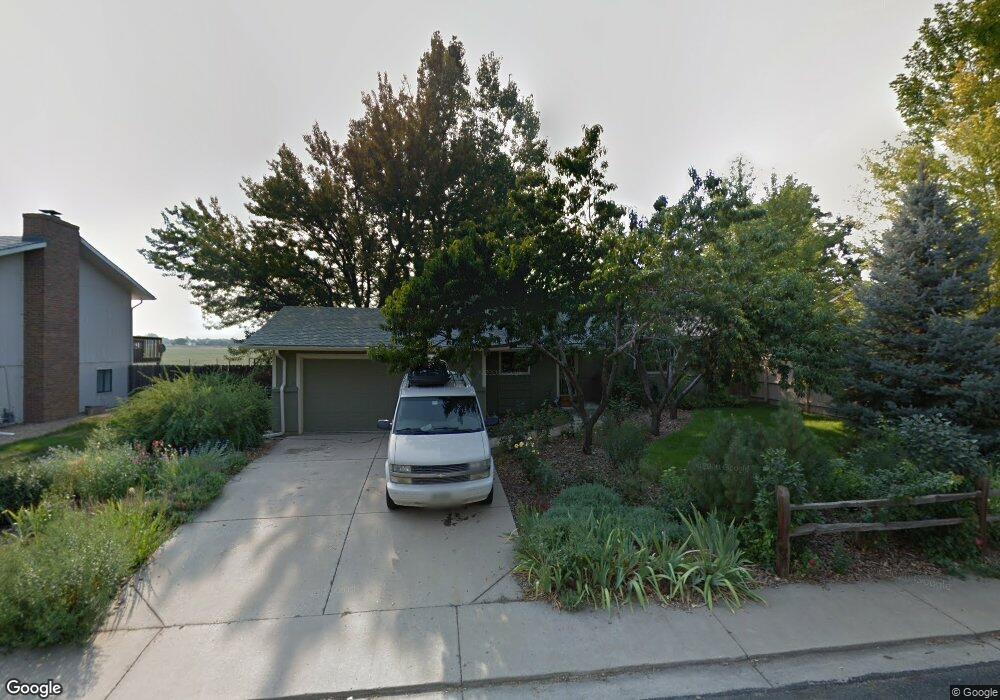
1615 Centaur Cir Lafayette, CO 80026
Estimated Value: $595,918 - $672,000
2
Beds
2
Baths
1,492
Sq Ft
$427/Sq Ft
Est. Value
About This Home
This home is located at 1615 Centaur Cir, Lafayette, CO 80026 and is currently estimated at $637,230, approximately $427 per square foot. 1615 Centaur Cir is a home located in Boulder County with nearby schools including Ryan Elementary School, Angevine Middle School, and Centaurus High School.
Ownership History
Date
Name
Owned For
Owner Type
Purchase Details
Closed on
Jun 21, 2012
Sold by
Sutton Scott K
Bought by
Sutton Scott K
Current Estimated Value
Home Financials for this Owner
Home Financials are based on the most recent Mortgage that was taken out on this home.
Original Mortgage
$164,000
Outstanding Balance
$113,444
Interest Rate
3.79%
Mortgage Type
New Conventional
Estimated Equity
$523,786
Purchase Details
Closed on
Sep 16, 2004
Sold by
Butler Jennifer B
Bought by
Sutton Scott K
Purchase Details
Closed on
Feb 26, 2003
Sold by
Lyman Clarence F
Bought by
Sutton Scott K and Butler Jennifer B
Home Financials for this Owner
Home Financials are based on the most recent Mortgage that was taken out on this home.
Original Mortgage
$209,630
Interest Rate
5.86%
Purchase Details
Closed on
May 27, 1976
Bought by
Sutton Scott K and Sutton Jeannette S
Create a Home Valuation Report for This Property
The Home Valuation Report is an in-depth analysis detailing your home's value as well as a comparison with similar homes in the area
Home Values in the Area
Average Home Value in this Area
Purchase History
| Date | Buyer | Sale Price | Title Company |
|---|---|---|---|
| Sutton Scott K | -- | Land Title Guarantee Company | |
| Sutton Scott K | -- | -- | |
| Sutton Scott K | $223,000 | -- | |
| Sutton Scott K | $37,400 | -- |
Source: Public Records
Mortgage History
| Date | Status | Borrower | Loan Amount |
|---|---|---|---|
| Open | Sutton Scott K | $164,000 | |
| Previous Owner | Sutton Scott K | $209,630 |
Source: Public Records
Tax History Compared to Growth
Tax History
| Year | Tax Paid | Tax Assessment Tax Assessment Total Assessment is a certain percentage of the fair market value that is determined by local assessors to be the total taxable value of land and additions on the property. | Land | Improvement |
|---|---|---|---|---|
| 2025 | $3,091 | $34,413 | $17,375 | $17,038 |
| 2024 | $3,091 | $34,413 | $17,375 | $17,038 |
| 2023 | $3,038 | $34,887 | $17,366 | $21,206 |
| 2022 | $2,660 | $28,322 | $13,539 | $14,783 |
| 2021 | $2,631 | $29,136 | $13,928 | $15,208 |
| 2020 | $2,500 | $27,349 | $11,154 | $16,195 |
| 2019 | $2,465 | $27,349 | $11,154 | $16,195 |
| 2018 | $2,219 | $24,307 | $10,656 | $13,651 |
| 2017 | $2,161 | $26,873 | $11,781 | $15,092 |
| 2016 | $1,914 | $20,847 | $8,517 | $12,330 |
| 2015 | $1,793 | $16,891 | $4,696 | $12,195 |
| 2014 | $1,461 | $16,891 | $4,696 | $12,195 |
Source: Public Records
Map
Nearby Homes
- 1892 Centaur Cir
- 1407 Lydia Dr Unit 61
- 2034 Gyros Cir Unit 153
- 1400 Agape Way
- 1711 Cato Cir Unit 21
- 1805 Chalcis Dr Unit A39
- 1117 Elysian Field Dr Unit B
- 1111 Elysian Field Dr Unit D
- 1116 Elysian Field Dr Unit F
- 1245 Ceres Dr
- 1065 Delta Dr Unit A
- 928 Cimarron Dr Unit c
- 1053 Delta Dr Unit B
- 1836 Lakespur Ln
- 1418 Marigold Dr
- 805 Argos Cir
- 759 Crystal Ct
- 1191 Milo Cir Unit A
- 1058 Griffith St
- 1045 Milo Cir Unit A
- 1617 Centaur Cir
- 1613 Centaur Cir
- 1611 Centaur Cir
- 1619 Centaur Cir
- 1616 Centaur Cir
- 1614 Centaur Cir
- 1609 Centaur Cir
- 1621 Centaur Cir
- 1703 Zeus Dr
- 1618 Centaur Cir
- 1622 Centaur Cir
- 1700 Zeus Dr
- 1705 Zeus Dr
- 1620 Centaur Cir
- 1623 Centaur Cir
- 1624 Centaur Cir
- 1707 Zeus Dr
- 1605 Centaur Cir
- 1702 Zeus Dr
- 1606 Centaur Cir