Estimated Value: $104,000 - $133,461
2
Beds
1
Bath
964
Sq Ft
$123/Sq Ft
Est. Value
About This Home
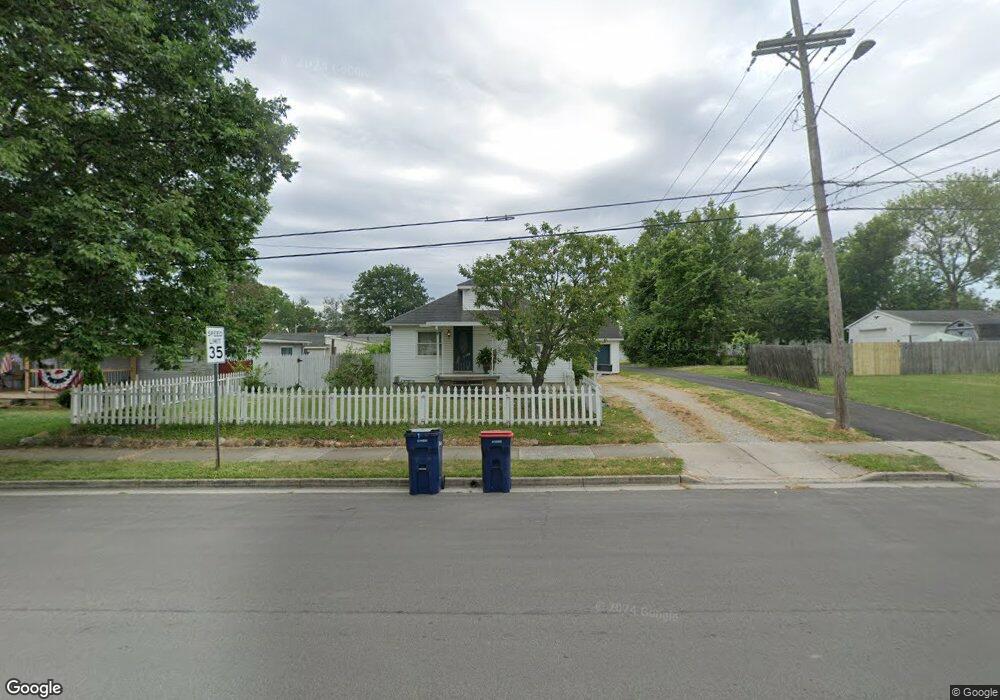
This home is located at 1615 Clark Ave, Piqua, OH 45356 and is currently estimated at $118,154, approximately $122 per square foot. 1615 Clark Ave is a home located in Miami County with nearby schools including Piqua Junior High School, Piqua High School, and Nicholas School.
Ownership History
Date
Name
Owned For
Owner Type
Purchase Details
Closed on
Jul 2, 2012
Sold by
Citimortgage Inc
Bought by
Mescher Christopher J and Merscher Jane
Current Estimated Value
Purchase Details
Closed on
Oct 11, 2011
Sold by
Vanpelt Terrence J and Van Pelt Carol A
Bought by
Citimortgage Inc
Purchase Details
Closed on
May 4, 2005
Sold by
Vanpelt Terrence J and Van Pelt Carol A
Bought by
Vanpelt Terrence J and Van Pelt Carol A
Purchase Details
Closed on
Oct 30, 2000
Sold by
First Bank National Assn
Bought by
Vanpelt Terrence J and Lantz Carol A
Home Financials for this Owner
Home Financials are based on the most recent Mortgage that was taken out on this home.
Original Mortgage
$43,225
Interest Rate
7.9%
Mortgage Type
New Conventional
Purchase Details
Closed on
Jun 23, 2000
Sold by
Willis George M and Willis Vicki L
Bought by
First Bank National Assn
Purchase Details
Closed on
Dec 21, 1994
Sold by
Liette Douglas
Bought by
Willis George M and Willis Vicki L
Create a Home Valuation Report for This Property
The Home Valuation Report is an in-depth analysis detailing your home's value as well as a comparison with similar homes in the area
Home Values in the Area
Average Home Value in this Area
Purchase History
| Date | Buyer | Sale Price | Title Company |
|---|---|---|---|
| Mescher Christopher J | $22,000 | Intitle Agency Inc | |
| Citimortgage Inc | -- | -- | |
| Vanpelt Terrence J | -- | -- | |
| Vanpelt Terrence J | $45,500 | -- | |
| First Bank National Assn | $42,000 | -- | |
| Willis George M | $26,900 | -- |
Source: Public Records
Mortgage History
| Date | Status | Borrower | Loan Amount |
|---|---|---|---|
| Previous Owner | First Bank National Assn | $43,225 | |
| Closed | Willis George M | -- |
Source: Public Records
Tax History Compared to Growth
Tax History
| Year | Tax Paid | Tax Assessment Tax Assessment Total Assessment is a certain percentage of the fair market value that is determined by local assessors to be the total taxable value of land and additions on the property. | Land | Improvement |
|---|---|---|---|---|
| 2024 | $1,153 | $27,340 | $6,230 | $21,110 |
| 2023 | $1,153 | $27,340 | $6,230 | $21,110 |
| 2022 | $1,173 | $27,340 | $6,230 | $21,110 |
| 2021 | $948 | $20,270 | $4,620 | $15,650 |
| 2020 | $932 | $20,270 | $4,620 | $15,650 |
| 2019 | $937 | $20,270 | $4,620 | $15,650 |
| 2018 | $971 | $20,030 | $4,660 | $15,370 |
| 2017 | $983 | $20,030 | $4,660 | $15,370 |
| 2016 | $973 | $20,030 | $4,660 | $15,370 |
| 2015 | $957 | $19,250 | $4,480 | $14,770 |
| 2014 | $957 | $19,250 | $4,480 | $14,770 |
| 2013 | $960 | $19,250 | $4,480 | $14,770 |
Source: Public Records
Map
Nearby Homes
- 708 Brice Ave
- 1110 South St
- 1005 South St
- 605 Boal Ave
- 1505 Amherst Ave
- 730 Gordon St
- 1320 Arrowhead
- 920 New Haven Rd
- 1513 Arrowhead Dr
- 825 Clark Ave
- 1502 Arrowhead Dr
- Ironwood Plan at Arrowhead Estates
- Juniper Plan at Arrowhead Estates
- Spruce Plan at Arrowhead Estates
- Aspen II Plan at Arrowhead Estates
- Norway Plan at Arrowhead Estates
- Palmetto Plan at Arrowhead Estates
- Walnut Plan at Arrowhead Estates
- Ashton Plan at Arrowhead Estates
- Empress Plan at Arrowhead Estates
- 1601 Clark Ave
- 705 Mckinley Ave
- 703 Mckinley Ave
- 806 Wilson Ave
- 707 Mckinley Ave
- 711 Mckinley Ave
- 810 Wilson Ave
- 629 Mckinley Ave
- 713 Mckinley Ave
- 809 Wilson Ave
- 724 Wilson Ave
- 835 Wilson Ave
- 627 Mckinley Ave
- 1520 Clark Ave
- 1519 Clark Ave
- 1519 Clark Ave
- 843 Wilson Ave
- 722 Wilson Ave
- 721 Wilson Ave
- 625 Mckinley Ave