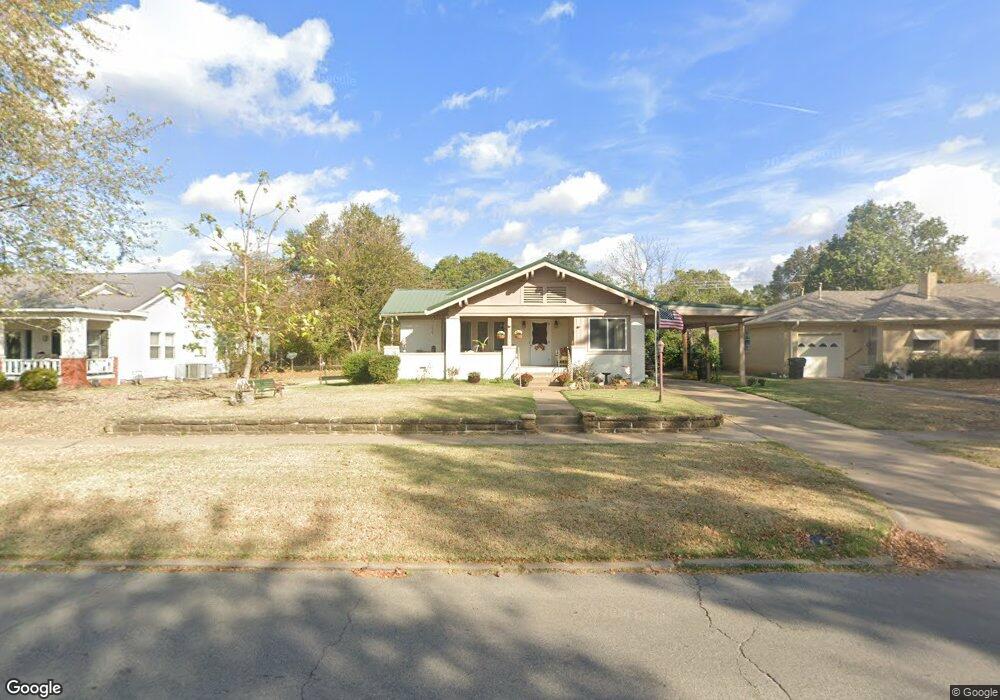
1615 E 8th St Okmulgee, OK 74447
Estimated Value: $142,208 - $180,000
3
Beds
2
Baths
2,082
Sq Ft
$77/Sq Ft
Est. Value
About This Home
This home is located at 1615 E 8th St, Okmulgee, OK 74447 and is currently estimated at $161,302, approximately $77 per square foot. 1615 E 8th St is a home located in Okmulgee County with nearby schools including Okmulgee Primary School, Dunbar Elementary School, and Okmulgee Middle School.
Ownership History
Date
Name
Owned For
Owner Type
Purchase Details
Closed on
Aug 21, 2007
Sold by
Wise Suzanne M
Bought by
Nix Phillip and Nix Kathleen
Current Estimated Value
Home Financials for this Owner
Home Financials are based on the most recent Mortgage that was taken out on this home.
Original Mortgage
$69,000
Interest Rate
6.72%
Mortgage Type
New Conventional
Purchase Details
Closed on
Dec 9, 1998
Sold by
Logan Inda Swearengen
Bought by
Wise Suzanne M
Create a Home Valuation Report for This Property
The Home Valuation Report is an in-depth analysis detailing your home's value as well as a comparison with similar homes in the area
Home Values in the Area
Average Home Value in this Area
Purchase History
| Date | Buyer | Sale Price | Title Company |
|---|---|---|---|
| Nix Phillip | $89,000 | None Available | |
| Wise Suzanne M | $57,500 | -- |
Source: Public Records
Mortgage History
| Date | Status | Borrower | Loan Amount |
|---|---|---|---|
| Closed | Nix Phillip | $69,000 |
Source: Public Records
Tax History
| Year | Tax Paid | Tax Assessment Tax Assessment Total Assessment is a certain percentage of the fair market value that is determined by local assessors to be the total taxable value of land and additions on the property. | Land | Improvement |
|---|---|---|---|---|
| 2025 | -- | $8,712 | $405 | $8,307 |
| 2024 | -- | $8,712 | $405 | $8,307 |
| 2023 | $614 | $8,212 | $405 | $7,807 |
| 2022 | $610 | $8,212 | $405 | $7,807 |
| 2021 | $632 | $8,212 | $405 | $7,807 |
| 2020 | $611 | $7,910 | $405 | $7,505 |
| 2019 | $590 | $7,680 | $405 | $7,275 |
| 2018 | $636 | $8,107 | $405 | $7,702 |
| 2017 | $682 | $8,707 | $405 | $8,302 |
| 2016 | $740 | $9,339 | $405 | $8,934 |
| 2015 | $703 | $9,167 | $405 | $8,762 |
| 2014 | $708 | $9,167 | $405 | $8,762 |
Source: Public Records
Map
Nearby Homes
Your Personal Tour Guide
Ask me questions while you tour the home.