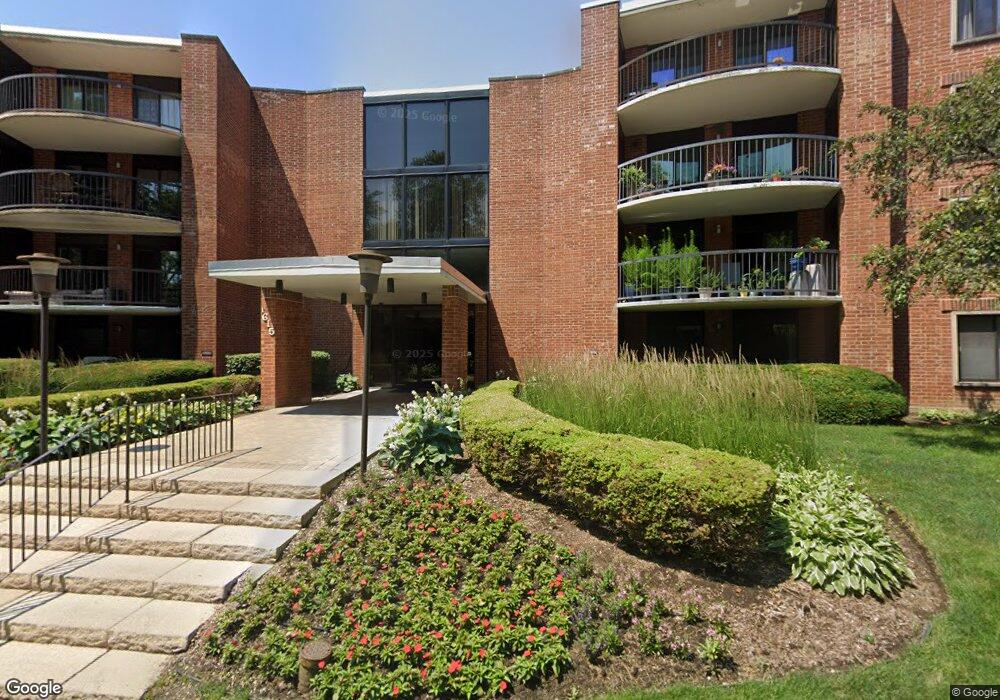
1615 E Central Rd Unit 213B Arlington Heights, IL 60005
Hatlen Heights NeighborhoodEstimated Value: $176,000 - $187,000
1
Bed
1
Bath
900
Sq Ft
$200/Sq Ft
Est. Value
About This Home
This home is located at 1615 E Central Rd Unit 213B, Arlington Heights, IL 60005 and is currently estimated at $180,224, approximately $200 per square foot. 1615 E Central Rd Unit 213B is a home located in Cook County with nearby schools including Fairview Elementary School, Lincoln Middle School, and Prospect High School.
Ownership History
Date
Name
Owned For
Owner Type
Purchase Details
Closed on
Jun 18, 2009
Sold by
Emiljanowicz Krzysztof
Bought by
Zielinski Piotr and Kotula Anna
Current Estimated Value
Home Financials for this Owner
Home Financials are based on the most recent Mortgage that was taken out on this home.
Original Mortgage
$85,000
Outstanding Balance
$53,444
Interest Rate
4.92%
Mortgage Type
Purchase Money Mortgage
Estimated Equity
$126,780
Purchase Details
Closed on
Apr 20, 2007
Sold by
Boryczko Jacek
Bought by
Emiljanowicz Krzysztof
Home Financials for this Owner
Home Financials are based on the most recent Mortgage that was taken out on this home.
Original Mortgage
$134,400
Interest Rate
6.19%
Mortgage Type
Purchase Money Mortgage
Purchase Details
Closed on
Nov 21, 1996
Sold by
Marofske David and Marofske Jeanette
Bought by
Boryczko Jacek
Home Financials for this Owner
Home Financials are based on the most recent Mortgage that was taken out on this home.
Original Mortgage
$60,400
Interest Rate
7.94%
Create a Home Valuation Report for This Property
The Home Valuation Report is an in-depth analysis detailing your home's value as well as a comparison with similar homes in the area
Home Values in the Area
Average Home Value in this Area
Purchase History
| Date | Buyer | Sale Price | Title Company |
|---|---|---|---|
| Zielinski Piotr | $100,000 | Saturn Title Llc | |
| Emiljanowicz Krzysztof | $168,000 | -- | |
| Boryczko Jacek | $75,500 | Attorneys Natl Title Network |
Source: Public Records
Mortgage History
| Date | Status | Borrower | Loan Amount |
|---|---|---|---|
| Open | Zielinski Piotr | $85,000 | |
| Previous Owner | Emiljanowicz Krzysztof | $134,400 | |
| Previous Owner | Boryczko Jacek | $60,400 |
Source: Public Records
Tax History
| Year | Tax Paid | Tax Assessment Tax Assessment Total Assessment is a certain percentage of the fair market value that is determined by local assessors to be the total taxable value of land and additions on the property. | Land | Improvement |
|---|---|---|---|---|
| 2025 | $2,098 | $14,880 | $2,432 | $12,448 |
| 2024 | $2,098 | $10,835 | $2,009 | $8,826 |
| 2023 | $1,979 | $10,835 | $2,009 | $8,826 |
| 2022 | $1,979 | $10,835 | $2,009 | $8,826 |
| 2021 | $1,930 | $9,528 | $1,268 | $8,260 |
| 2020 | $1,956 | $9,528 | $1,268 | $8,260 |
| 2019 | $1,960 | $10,612 | $1,268 | $9,344 |
| 2018 | $1,245 | $7,537 | $1,057 | $6,480 |
| 2017 | $1,246 | $7,537 | $1,057 | $6,480 |
| 2016 | $1,297 | $7,537 | $1,057 | $6,480 |
| 2015 | $1,536 | $5,472 | $951 | $4,521 |
| 2014 | $1,511 | $5,472 | $951 | $4,521 |
| 2013 | $1,510 | $5,472 | $951 | $4,521 |
Source: Public Records
Map
Nearby Homes
- 1615 E Central Rd Unit 417C
- 1405 E Central Rd Unit 222C
- 1703 Bonita Ave
- 1415 E Central Rd Unit 306A
- 1415 E Central Rd Unit 219C
- 240 Hatlen Ave
- 8 Rob Rd
- 1707 W Lincoln St
- 413 S Carol Ln
- 1042 W Central Rd
- 1229 S Haddow Ave
- 606 S Roosevelt Ave
- 901 S Burton Place
- 525 S Cleveland Ave Unit 208
- 525 S Cleveland Ave Unit 104
- 532 Lois Ct
- 703 W Central Rd Unit 1C8
- 1454 E Northwest Hwy
- 507 S Waterman Ave
- 607 W Central Rd Unit A4
- 1615 E Central Rd Unit 115B
- 1615 E Central Rd Unit 408A
- 1615 E Central Rd Unit 122C
- 1615 E Central Rd Unit 307A
- 1615 E Central Rd Unit 117C
- 1615 E Central Rd Unit 308A
- 1615 E Central Rd Unit 401A
- 1615 E Central Rd Unit 305A
- 1615 E Central Rd Unit 413B
- 1615 E Central Rd Unit 216B
- 1615 E Central Rd Unit 209B
- 1615 E Central Rd Unit 309B
- 1615 E Central Rd Unit 306A
- 1615 E Central Rd Unit 411B
- 1615 E Central Rd Unit 313B
- 1615 E Central Rd Unit 120C
- 1615 E Central Rd Unit 317A
- 1615 E Central Rd Unit 419C
- 1615 E Central Rd Unit 110B
- 1615 E Central Rd Unit 310B
Your Personal Tour Guide
Ask me questions while you tour the home.