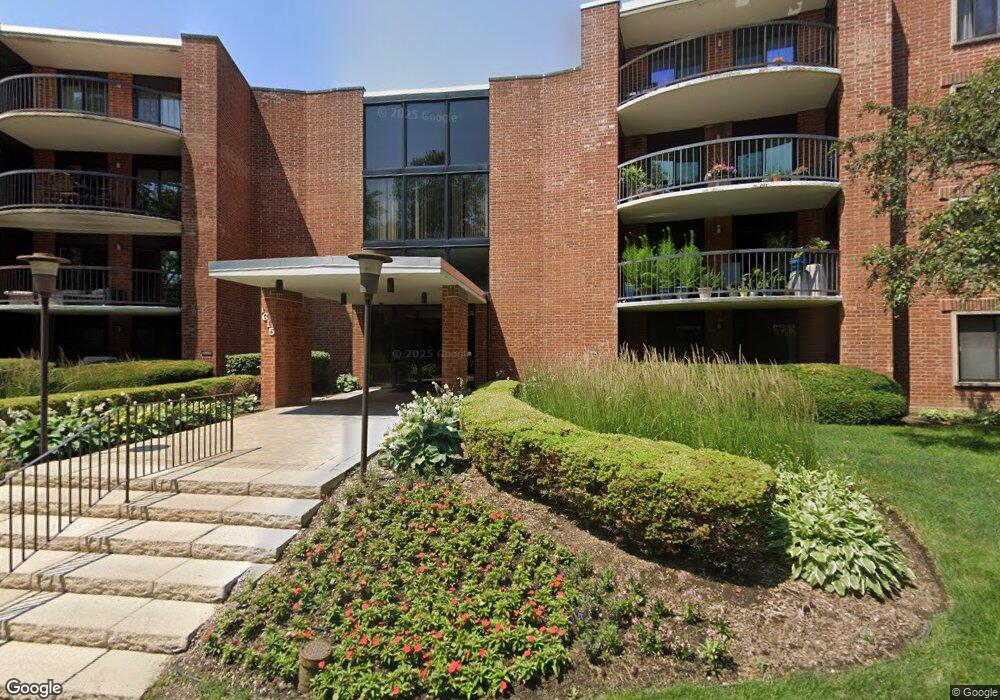
1615 E Central Rd Unit 313B Arlington Heights, IL 60005
Hatlen Heights NeighborhoodEstimated Value: $153,391 - $198,000
1
Bed
--
Bath
408,000
Sq Ft
$0/Sq Ft
Est. Value
About This Home
This home is located at 1615 E Central Rd Unit 313B, Arlington Heights, IL 60005 and is currently estimated at $180,098, approximately $0 per square foot. 1615 E Central Rd Unit 313B is a home located in Cook County with nearby schools including Fairview Elementary School, Lincoln Middle School, and Prospect High School.
Ownership History
Date
Name
Owned For
Owner Type
Purchase Details
Closed on
Jul 26, 2007
Sold by
Waksmundzka Aniela
Bought by
Waksmundzka Aniela and Aniela Waksmundzka Living Trus
Current Estimated Value
Purchase Details
Closed on
Jul 28, 2006
Sold by
Vitaioli Catherine
Bought by
Waksmundzka Aniela
Home Financials for this Owner
Home Financials are based on the most recent Mortgage that was taken out on this home.
Original Mortgage
$73,000
Interest Rate
6.49%
Mortgage Type
Purchase Money Mortgage
Purchase Details
Closed on
Jul 27, 2004
Sold by
Sudrovech Kristine K
Bought by
Vitaioli Catherine
Home Financials for this Owner
Home Financials are based on the most recent Mortgage that was taken out on this home.
Original Mortgage
$119,200
Interest Rate
6.08%
Mortgage Type
Purchase Money Mortgage
Create a Home Valuation Report for This Property
The Home Valuation Report is an in-depth analysis detailing your home's value as well as a comparison with similar homes in the area
Home Values in the Area
Average Home Value in this Area
Purchase History
We collect this data history from publicly available records. To have your information removed, we recommend requesting removal directly through your county’s website.
| Date | Buyer | Sale Price | Title Company |
|---|---|---|---|
| Waksmundzka Aniela | -- | None Available | |
| Waksmundzka Aniela | $161,000 | None Available | |
| Vitaioli Catherine | $149,000 | 1St American Title |
Source: Public Records
Mortgage History
We collect this data history from publicly available records. To have your information removed, we recommend requesting removal directly through your county’s website.
| Date | Status | Borrower | Loan Amount |
|---|---|---|---|
| Previous Owner | Waksmundzka Aniela | $73,000 | |
| Previous Owner | Vitaioli Catherine | $119,200 |
Source: Public Records
Tax History
| Year | Tax Paid | Tax Assessment Tax Assessment Total Assessment is a certain percentage of the fair market value that is determined by local assessors to be the total taxable value of land and additions on the property. | Land | Improvement |
|---|---|---|---|---|
| 2025 | -- | $15,086 | $2,466 | $12,620 |
| 2024 | -- | $10,984 | $2,037 | $8,947 |
| 2023 | -- | $10,984 | $2,037 | $8,947 |
| 2022 | $0 | $10,984 | $2,037 | $8,947 |
| 2021 | $254 | $9,660 | $1,286 | $8,374 |
| 2020 | $254 | $9,660 | $1,286 | $8,374 |
| 2019 | $0 | $10,758 | $1,286 | $9,472 |
| 2018 | $0 | $7,641 | $1,072 | $6,569 |
| 2017 | $140 | $7,641 | $1,072 | $6,569 |
| 2016 | $254 | $7,641 | $1,072 | $6,569 |
| 2015 | $291 | $5,547 | $964 | $4,583 |
| 2014 | $280 | $5,547 | $964 | $4,583 |
| 2013 | -- | $5,547 | $964 | $4,583 |
Source: Public Records
Map
Nearby Homes
- 1515 E Central Rd Unit 462B
- 1405 E Central Rd Unit 222C
- 1703 Bonita Ave
- 1719 Verde Dr
- 1715 Verde Ct
- 22 Audrey Ln
- 8 Rob Rd
- 831 S Dryden Place
- 1255 W Prospect Ave Unit 109
- 819 S Beverly Ln
- 214 N Cathy Ln Unit 28
- 206 S See Gwun Ave
- 513 E Central Rd
- 909 E Rockwell St
- 535 S Cleveland Ave Unit 406
- 404 S Helena Ave
- 606 S Roosevelt Ave
- 532 S Waterman Ave
- 525 S Cleveland Ave Unit 104
- 444 S Gibbons Ave
- 1615 E Central Rd Unit 115B
- 1615 E Central Rd Unit 408A
- 1615 E Central Rd Unit 307A
- 1615 E Central Rd Unit 117C
- 1615 E Central Rd Unit 308A
- 1615 E Central Rd Unit 401A
- 1615 E Central Rd Unit 305A
- 1615 E Central Rd Unit 413B
- 1615 E Central Rd Unit 216B
- 1615 E Central Rd Unit 209B
- 1615 E Central Rd Unit 309B
- 1615 E Central Rd Unit 306A
- 1615 E Central Rd Unit 213B
- 1615 E Central Rd Unit 411B
- 1615 E Central Rd Unit 120C
- 1615 E Central Rd Unit 317A
- 1615 E Central Rd Unit 419C
- 1615 E Central Rd Unit 110B
- 1615 E Central Rd Unit 310B
- 1615 E Central Rd Unit 214B
Your Personal Tour Guide
Ask me questions while you tour the home.