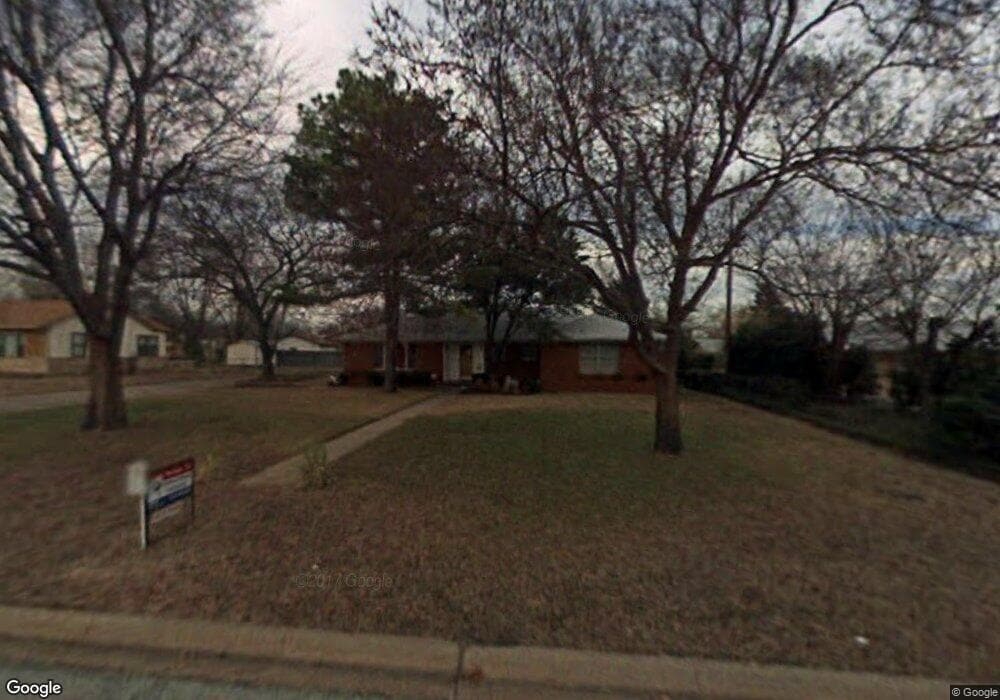
1615 E Peyton St Sherman, TX 75090
Estimated Value: $281,000 - $295,257
3
Beds
2
Baths
2,221
Sq Ft
$130/Sq Ft
Est. Value
About This Home
This home is located at 1615 E Peyton St, Sherman, TX 75090 and is currently estimated at $288,129, approximately $129 per square foot. 1615 E Peyton St is a home located in Grayson County with nearby schools including Percy W. Neblett Elementary School, Dillingham Intermediate School, and Piner Middle School.
Ownership History
Date
Name
Owned For
Owner Type
Purchase Details
Closed on
Jun 7, 2010
Sold by
Henson Dean W and Henson Kathleen J
Bought by
Bock William Joseph
Current Estimated Value
Home Financials for this Owner
Home Financials are based on the most recent Mortgage that was taken out on this home.
Original Mortgage
$45,000
Outstanding Balance
$30,203
Interest Rate
5%
Mortgage Type
New Conventional
Estimated Equity
$257,926
Purchase Details
Closed on
Aug 24, 2004
Sold by
Bruckner Jon and Bruckner Jinger
Bought by
Henson Dean W and Henson Kathleen J
Home Financials for this Owner
Home Financials are based on the most recent Mortgage that was taken out on this home.
Original Mortgage
$72,800
Interest Rate
6%
Mortgage Type
Purchase Money Mortgage
Create a Home Valuation Report for This Property
The Home Valuation Report is an in-depth analysis detailing your home's value as well as a comparison with similar homes in the area
Home Values in the Area
Average Home Value in this Area
Purchase History
| Date | Buyer | Sale Price | Title Company |
|---|---|---|---|
| Bock William Joseph | -- | Red River Title Co | |
| Henson Dean W | -- | -- |
Source: Public Records
Mortgage History
| Date | Status | Borrower | Loan Amount |
|---|---|---|---|
| Open | Bock William Joseph | $45,000 | |
| Previous Owner | Henson Dean W | $72,800 | |
| Closed | Henson Dean W | $18,200 |
Source: Public Records
Tax History
| Year | Tax Paid | Tax Assessment Tax Assessment Total Assessment is a certain percentage of the fair market value that is determined by local assessors to be the total taxable value of land and additions on the property. | Land | Improvement |
|---|---|---|---|---|
| 2025 | -- | $235,041 | -- | -- |
| 2024 | $4,686 | $213,674 | $0 | $0 |
| 2023 | $4,552 | $194,249 | $0 | $0 |
| 2022 | $4,139 | $176,590 | $0 | $0 |
| 2021 | $4,024 | $160,536 | $23,450 | $137,086 |
| 2020 | $4,182 | $165,030 | $23,450 | $141,580 |
| 2019 | $3,797 | $147,344 | $10,150 | $137,194 |
| 2018 | $3,213 | $128,052 | $10,150 | $117,902 |
| 2017 | $3,064 | $123,073 | $10,150 | $112,923 |
| 2016 | $2,900 | $116,515 | $10,150 | $106,365 |
Source: Public Records
Map
Nearby Homes
- 1609 E Peyton St
- 1515 E Nall St
- 1721 N Hoard Ave
- 2012 Texoma Pkwy
- 1511 N Brents Ave
- TBD E Peyton St Unit 15.125 acres
- 13 E Lewis St
- 2700 E Buck Owens Fwy
- 1416 N Cleveland Ave
- 805 Peachtree Place
- 1705 La Salle Dr
- 2233 E Tuck St
- 000 N Masters St
- 4502 Carnation Dr
- 4600 Carnation Dr
- 3424 Spur Run
- 3420 Spur Run
- 3432 Spur Run
- 2239 E Tuck St
- 3014 Northridge Dr
- 1611 E Peyton St
- 1701 E Peyton St
- 1604 E Ann Ave
- 1608 E Ann Ave
- 1600 E Ann St
- 1600 E Ann Ave
- 1705 E Peyton St
- 1612 E Peyton St
- 1612 E Ann Ave
- 1608 E Peyton St
- 1616 E Peyton St
- 1605 E Peyton St
- 1709 E Peyton St
- 1702 E Peyton St
- 1601 E Ann Ave
- 1706 E Peyton St
- 1605 E Ann Ave
- 1616 E Ann Ave
- 1704 E Ann Ave
- 1713 E Peyton St
Your Personal Tour Guide
Ask me questions while you tour the home.