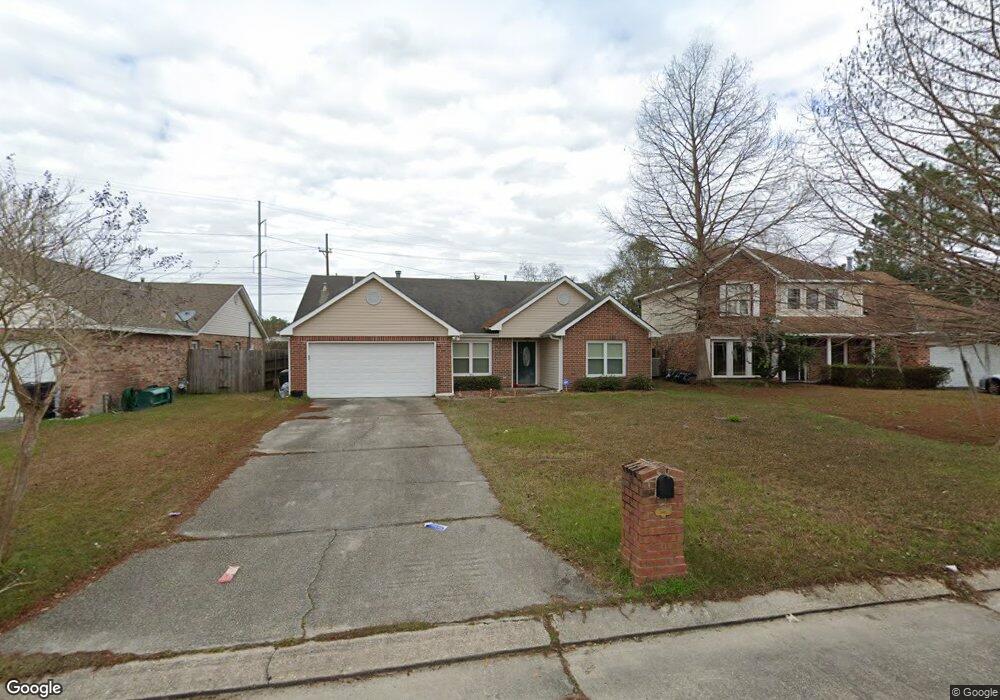
1615 Kings Row Other Slidell, LA 70461
Estimated Value: $185,000 - $213,000
3
Beds
2
Baths
1,632
Sq Ft
$119/Sq Ft
Est. Value
About This Home
This home is located at 1615 Kings Row Other, Slidell, LA 70461 and is currently estimated at $194,598, approximately $119 per square foot. 1615 Kings Row Other is a home located in St. Tammany Parish with nearby schools including W.L. Abney Elementary School, St. Tammany Junior High School, and Salmen High School.
Ownership History
Date
Name
Owned For
Owner Type
Purchase Details
Closed on
Jun 25, 2014
Sold by
Hud
Bought by
Evans Shawnte M
Current Estimated Value
Home Financials for this Owner
Home Financials are based on the most recent Mortgage that was taken out on this home.
Original Mortgage
$88,000
Outstanding Balance
$67,205
Interest Rate
4.23%
Mortgage Type
New Conventional
Estimated Equity
$127,393
Purchase Details
Closed on
Sep 25, 2013
Sold by
Citimortgage Inc
Bought by
Secretary Of Hud
Purchase Details
Closed on
Aug 28, 2013
Sold by
Scott Troy L
Bought by
Citimortgage Inc
Purchase Details
Closed on
Mar 22, 2011
Sold by
Cook Deharde Angie M and Deharde Henry D
Bought by
Scott Troy L
Home Financials for this Owner
Home Financials are based on the most recent Mortgage that was taken out on this home.
Original Mortgage
$125,947
Interest Rate
4.98%
Mortgage Type
FHA
Create a Home Valuation Report for This Property
The Home Valuation Report is an in-depth analysis detailing your home's value as well as a comparison with similar homes in the area
Home Values in the Area
Average Home Value in this Area
Purchase History
| Date | Buyer | Sale Price | Title Company |
|---|---|---|---|
| Evans Shawnte M | -- | Bayou Title | |
| Secretary Of Hud | $123,837 | None Available | |
| Citimortgage Inc | $82,667 | None Available | |
| Scott Troy L | $130,000 | Bayou Title Inc |
Source: Public Records
Mortgage History
| Date | Status | Borrower | Loan Amount |
|---|---|---|---|
| Open | Evans Shawnte M | $88,000 | |
| Previous Owner | Scott Troy L | $125,947 |
Source: Public Records
Tax History Compared to Growth
Tax History
| Year | Tax Paid | Tax Assessment Tax Assessment Total Assessment is a certain percentage of the fair market value that is determined by local assessors to be the total taxable value of land and additions on the property. | Land | Improvement |
|---|---|---|---|---|
| 2024 | $1,430 | $16,558 | $1,900 | $14,658 |
| 2023 | $1,477 | $13,081 | $2,000 | $11,081 |
| 2022 | $96,540 | $13,081 | $2,000 | $11,081 |
| 2021 | $964 | $13,081 | $2,000 | $11,081 |
| 2020 | $960 | $13,081 | $2,000 | $11,081 |
| 2019 | $1,871 | $11,612 | $1,560 | $10,052 |
| 2018 | $1,878 | $11,612 | $1,560 | $10,052 |
| 2017 | $1,889 | $11,612 | $1,560 | $10,052 |
| 2016 | $1,930 | $11,612 | $1,560 | $10,052 |
| 2015 | $744 | $11,165 | $1,500 | $9,665 |
| 2014 | $733 | $11,165 | $1,500 | $9,665 |
| 2013 | -- | $11,165 | $1,500 | $9,665 |
Source: Public Records
Map
Nearby Homes
- 1615 Kings Row
- 1613 Kings Row
- 1617 Kings Row
- 1617 Kings Row None
- 1701 Kings Row None
- 1611 Kings Row
- 1701 Kings Row
- 1611 Kings Row Other
- 1698 Kingsrow Other
- 1703 Kings Row Other
- 1696 Kings Row
- 1609 Kings Row Other
- 1609 Kings Row
- 1703 Kings Row
- 1703 Kings Row None
- 1694 Kings Row Other
- 1698 Kings Row
- 1694 Kings Row
- 1700 Kings Row
- 1607 Kings Row