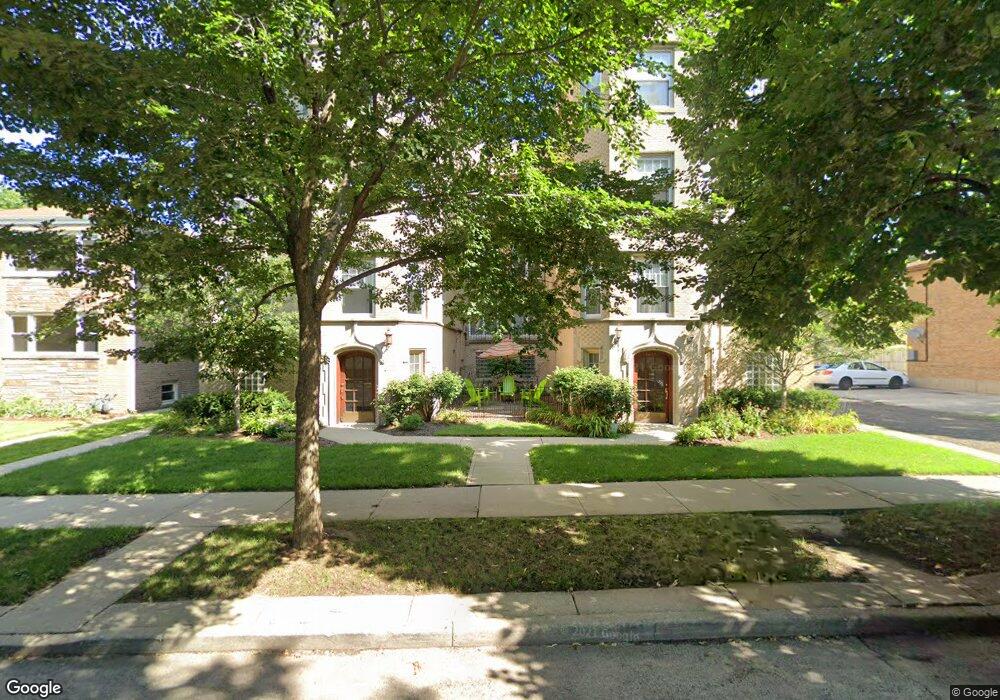
1615 Monroe St Unit 16152S Evanston, IL 60202
Estimated Value: $177,000 - $210,000
1
Bed
--
Bath
750
Sq Ft
$259/Sq Ft
Est. Value
About This Home
This home is located at 1615 Monroe St Unit 16152S, Evanston, IL 60202 and is currently estimated at $193,921, approximately $258 per square foot. 1615 Monroe St Unit 16152S is a home located in Cook County with nearby schools including Nichols Middle School, Evanston Township High School, and Pope John XXIII School.
Ownership History
Date
Name
Owned For
Owner Type
Purchase Details
Closed on
Dec 16, 2023
Sold by
Venkata Mary Slater
Bought by
Christiga Llc
Current Estimated Value
Purchase Details
Closed on
Jul 9, 2021
Sold by
Olsen Christine
Bought by
Venkata Mary Slater
Purchase Details
Closed on
Jul 19, 2016
Sold by
Alder Carolyn J
Bought by
Olsen Christine
Home Financials for this Owner
Home Financials are based on the most recent Mortgage that was taken out on this home.
Original Mortgage
$89,180
Interest Rate
3.62%
Mortgage Type
New Conventional
Purchase Details
Closed on
Nov 5, 2004
Sold by
Mpt Properties Llc
Bought by
Alder Carolyn J
Home Financials for this Owner
Home Financials are based on the most recent Mortgage that was taken out on this home.
Original Mortgage
$125,000
Interest Rate
4.25%
Mortgage Type
Unknown
Create a Home Valuation Report for This Property
The Home Valuation Report is an in-depth analysis detailing your home's value as well as a comparison with similar homes in the area
Home Values in the Area
Average Home Value in this Area
Purchase History
| Date | Buyer | Sale Price | Title Company |
|---|---|---|---|
| Christiga Llc | -- | None Listed On Document | |
| Venkata Mary Slater | $140,000 | Affinity Title Services Llc | |
| Olsen Christine | $127,500 | Baird & Warner Title Service | |
| Alder Carolyn J | $192,000 | First American Title |
Source: Public Records
Mortgage History
| Date | Status | Borrower | Loan Amount |
|---|---|---|---|
| Previous Owner | Olsen Christine | $89,180 | |
| Previous Owner | Alder Carolyn J | $125,000 |
Source: Public Records
Tax History Compared to Growth
Tax History
| Year | Tax Paid | Tax Assessment Tax Assessment Total Assessment is a certain percentage of the fair market value that is determined by local assessors to be the total taxable value of land and additions on the property. | Land | Improvement |
|---|---|---|---|---|
| 2024 | $3,324 | $13,551 | $1,160 | $12,391 |
| 2023 | $3,188 | $13,551 | $1,160 | $12,391 |
| 2022 | $3,188 | $13,551 | $1,160 | $12,391 |
| 2021 | $942 | $11,073 | $843 | $10,230 |
| 2020 | $866 | $11,073 | $843 | $10,230 |
| 2019 | $856 | $12,369 | $843 | $11,526 |
| 2018 | $813 | $9,798 | $703 | $9,095 |
| 2017 | $1,006 | $9,798 | $703 | $9,095 |
| 2016 | $1,871 | $9,798 | $703 | $9,095 |
| 2015 | $1,762 | $9,102 | $580 | $8,522 |
| 2014 | $2,046 | $9,831 | $580 | $9,251 |
| 2013 | $2,413 | $11,802 | $580 | $11,222 |
Source: Public Records
Map
Nearby Homes
- 704 Florence Ave
- 1810 Washington St
- 604 Dodge Ave
- 1408 Seward St
- 1916 Keeney St
- 532 Wesley Ave Unit WEST
- 1810 South Blvd
- 1927 Warren St
- 647 Asbury Ave
- 1037 Dodge Ave
- 419 Florence Ave
- 2213 Cleveland St
- 401 Dewey Ave
- SAN JUAN GRANDE La Cascabela
- 1025 Wesley Ave
- 553 Barton Ave
- 347 Florence Ave
- 1114 Main St Unit 1W
- 1133 Dodge Ave
- 325 Dodge Ave
- 1615 Monroe St Unit 16153S
- 1615 Monroe St Unit 16153N
- 1615 Monroe St Unit 16152N
- 1615 Monroe St Unit 16151S
- 1615 Monroe St Unit 16151N
- 1615 Monroe St Unit 3S
- 1615 Monroe St Unit 2S
- 1615 Monroe St Unit 2N
- 1615 Monroe St Unit 1N
- 1615 Monroe St Unit 1S
- 1613 Monroe St Unit 16133N
- 1613 Monroe St Unit 16132N
- 1613 Monroe St Unit 16133S
- 1613 Monroe St Unit 16132S
- 1613 Monroe St Unit 16131S
- 1613 Monroe St Unit 16131N
- 1613 Monroe St Unit 2N
- 1613 Monroe St Unit 1N
- 1613 Monroe St Unit 2S
- 1619 Monroe St Unit 1