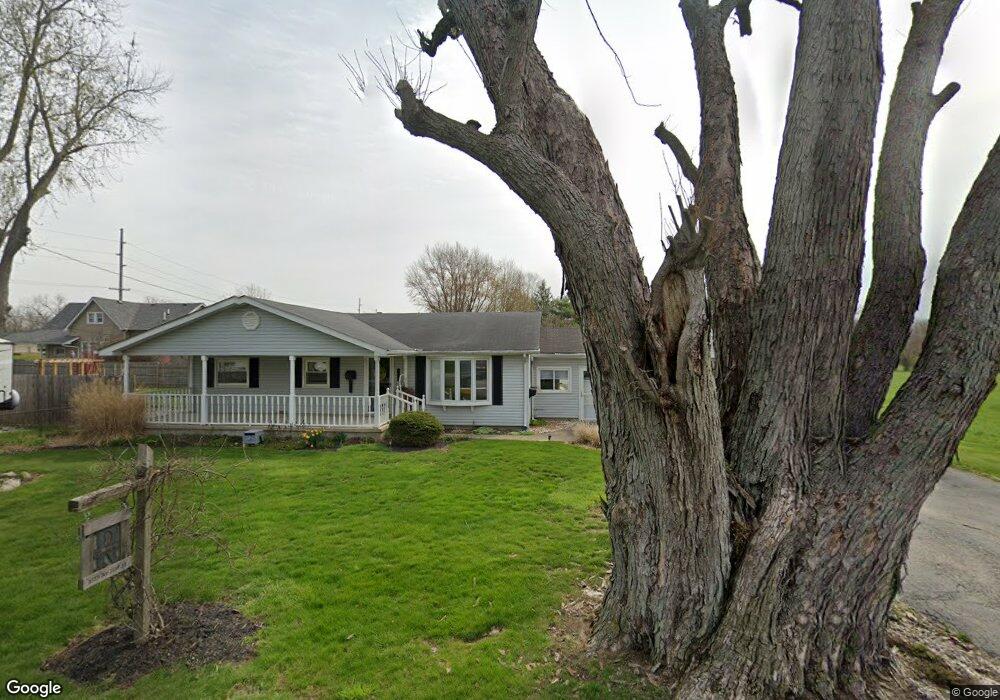
1615 S 21st St Elwood, IN 46036
Estimated Value: $141,000 - $155,368
3
Beds
1
Bath
1,080
Sq Ft
$138/Sq Ft
Est. Value
About This Home
This home is located at 1615 S 21st St, Elwood, IN 46036 and is currently estimated at $149,092, approximately $138 per square foot. 1615 S 21st St is a home located in Madison County with nearby schools including Elwood Elementary School, Elwood Intermediate School, and Elwood Junior-Senior High School.
Ownership History
Date
Name
Owned For
Owner Type
Purchase Details
Closed on
Nov 14, 2024
Sold by
Reeves David S
Bought by
Reeves David S and Reeves Debra
Current Estimated Value
Purchase Details
Closed on
Mar 13, 2013
Sold by
Caldwell Carolyn A
Bought by
Reeves David S
Home Financials for this Owner
Home Financials are based on the most recent Mortgage that was taken out on this home.
Original Mortgage
$75,000
Interest Rate
3.5%
Mortgage Type
New Conventional
Create a Home Valuation Report for This Property
The Home Valuation Report is an in-depth analysis detailing your home's value as well as a comparison with similar homes in the area
Home Values in the Area
Average Home Value in this Area
Purchase History
| Date | Buyer | Sale Price | Title Company |
|---|---|---|---|
| Reeves David S | -- | None Listed On Document | |
| Reeves David S | -- | -- |
Source: Public Records
Mortgage History
| Date | Status | Borrower | Loan Amount |
|---|---|---|---|
| Previous Owner | Reeves David S | $75,000 |
Source: Public Records
Tax History Compared to Growth
Tax History
| Year | Tax Paid | Tax Assessment Tax Assessment Total Assessment is a certain percentage of the fair market value that is determined by local assessors to be the total taxable value of land and additions on the property. | Land | Improvement |
|---|---|---|---|---|
| 2024 | $681 | $99,900 | $10,700 | $89,200 |
| 2023 | $651 | $91,400 | $10,200 | $81,200 |
| 2022 | $649 | $90,900 | $9,700 | $81,200 |
| 2021 | $566 | $84,100 | $9,700 | $74,400 |
| 2020 | $526 | $80,600 | $9,300 | $71,300 |
| 2019 | $601 | $84,800 | $9,300 | $75,500 |
| 2018 | $594 | $84,800 | $9,300 | $75,500 |
| 2017 | $540 | $83,700 | $9,300 | $74,400 |
| 2016 | $460 | $78,500 | $9,300 | $69,200 |
| 2014 | $444 | $78,900 | $9,300 | $69,600 |
| 2013 | $444 | $78,900 | $9,300 | $69,600 |
Source: Public Records
Map
Nearby Homes