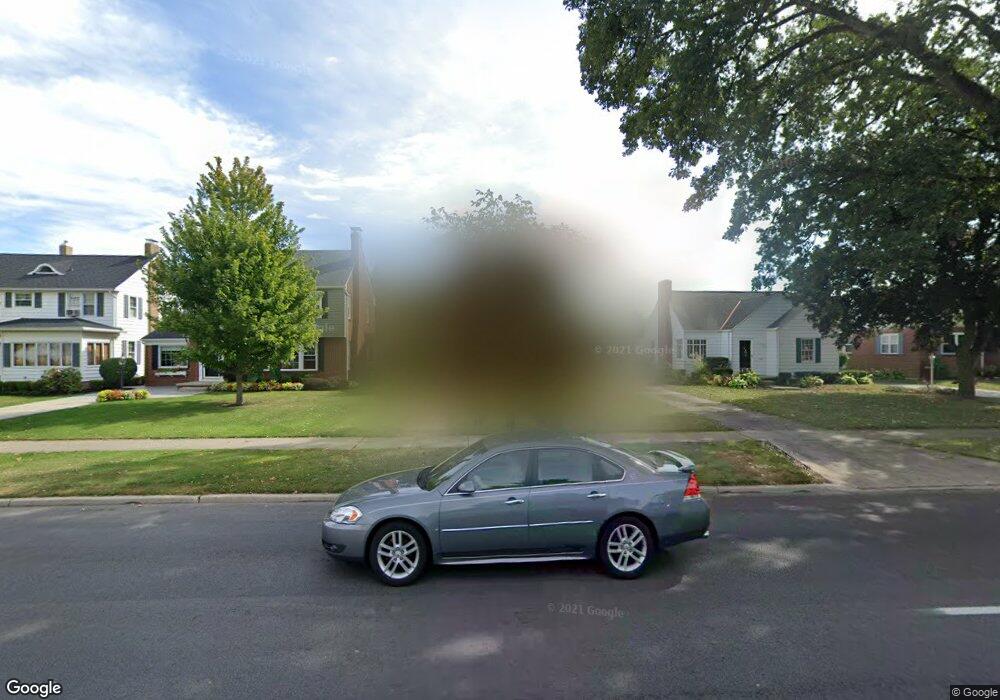
1615 S Main St Findlay, OH 45840
Estimated Value: $240,716 - $268,000
3
Beds
3
Baths
2,254
Sq Ft
$114/Sq Ft
Est. Value
About This Home
This home is located at 1615 S Main St, Findlay, OH 45840 and is currently estimated at $255,929, approximately $113 per square foot. 1615 S Main St is a home located in Hancock County with nearby schools including Jefferson Elementary School, Chamberlin Hill Elementary School, and Donnell Middle School.
Ownership History
Date
Name
Owned For
Owner Type
Purchase Details
Closed on
Aug 24, 2005
Sold by
Schmidt Frederick H
Bought by
Dafler Richard J and Dafler Christy B
Current Estimated Value
Home Financials for this Owner
Home Financials are based on the most recent Mortgage that was taken out on this home.
Original Mortgage
$112,000
Interest Rate
5.8%
Mortgage Type
Purchase Money Mortgage
Purchase Details
Closed on
Jan 24, 2001
Sold by
Burke Beth A
Bought by
Schmidt Frederick H
Home Financials for this Owner
Home Financials are based on the most recent Mortgage that was taken out on this home.
Original Mortgage
$70,000
Interest Rate
7.43%
Mortgage Type
New Conventional
Purchase Details
Closed on
Apr 15, 1992
Bought by
Haley Ruth E and Beth Ann
Purchase Details
Closed on
Dec 15, 1986
Bought by
Haley James T and Haley Ruth
Create a Home Valuation Report for This Property
The Home Valuation Report is an in-depth analysis detailing your home's value as well as a comparison with similar homes in the area
Home Values in the Area
Average Home Value in this Area
Purchase History
| Date | Buyer | Sale Price | Title Company |
|---|---|---|---|
| Dafler Richard J | $140,000 | Assured Title | |
| Schmidt Frederick H | $129,500 | -- | |
| Haley Ruth E | -- | -- | |
| Haley James T | $60,000 | -- |
Source: Public Records
Mortgage History
| Date | Status | Borrower | Loan Amount |
|---|---|---|---|
| Previous Owner | Dafler Richard J | $112,000 | |
| Previous Owner | Schmidt Frederick H | $70,000 |
Source: Public Records
Tax History Compared to Growth
Tax History
| Year | Tax Paid | Tax Assessment Tax Assessment Total Assessment is a certain percentage of the fair market value that is determined by local assessors to be the total taxable value of land and additions on the property. | Land | Improvement |
|---|---|---|---|---|
| 2024 | $2,050 | $57,710 | $5,250 | $52,460 |
| 2023 | $2,053 | $57,710 | $5,250 | $52,460 |
| 2022 | $2,046 | $57,710 | $5,250 | $52,460 |
| 2021 | $1,976 | $48,560 | $5,250 | $43,310 |
| 2020 | $1,976 | $48,560 | $5,250 | $43,310 |
| 2019 | $1,936 | $48,560 | $5,250 | $43,310 |
| 2018 | $1,690 | $38,840 | $4,200 | $34,640 |
| 2017 | $844 | $38,840 | $4,200 | $34,640 |
| 2016 | $1,669 | $38,840 | $4,200 | $34,640 |
| 2015 | $2,014 | $46,050 | $4,900 | $41,150 |
| 2014 | $2,014 | $46,050 | $4,900 | $41,150 |
| 2012 | $2,030 | $46,050 | $4,900 | $41,150 |
Source: Public Records
Map
Nearby Homes