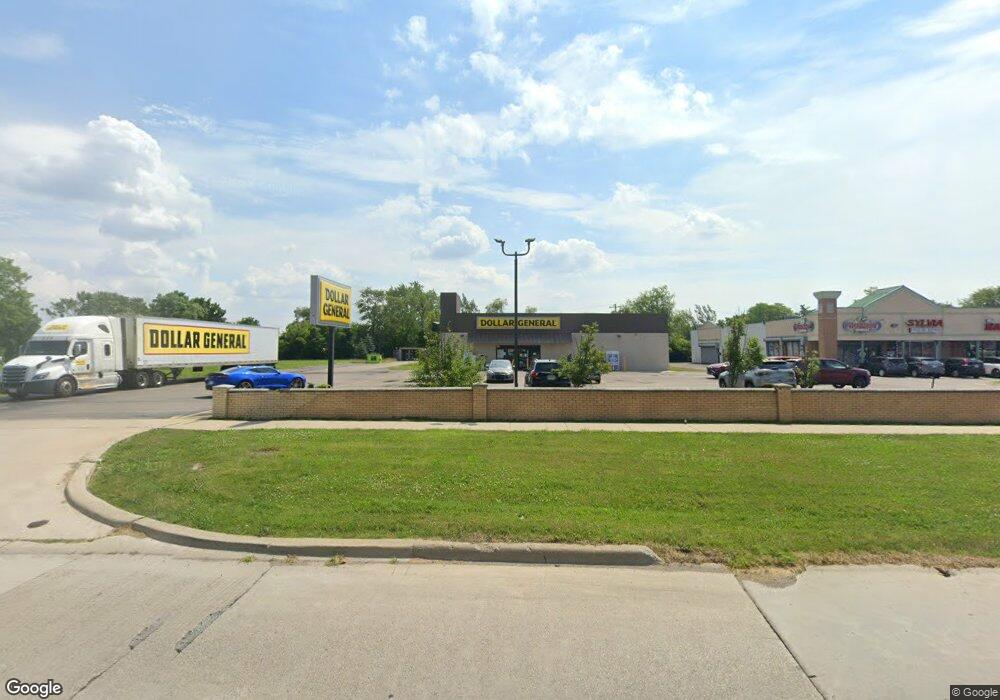
1615 S Merriman Rd Westland, MI 48186
Estimated Value: $2,100,677
--
Bed
--
Bath
9,400
Sq Ft
$223/Sq Ft
Est. Value
About This Home
This home is located at 1615 S Merriman Rd, Westland, MI 48186 and is currently estimated at $2,100,677, approximately $223 per square foot. 1615 S Merriman Rd is a home located in Wayne County with nearby schools including Eugene B. Elliott Elementary School, Adams Middle School, and Benjamin Franklin Middle School.
Ownership History
Date
Name
Owned For
Owner Type
Purchase Details
Closed on
Oct 6, 2016
Sold by
West On West Llc
Bought by
Westminster Development Llc
Current Estimated Value
Purchase Details
Closed on
Nov 6, 2012
Sold by
Amcer Property Llc
Bought by
Amcer Merriman Property Llc
Purchase Details
Closed on
Feb 29, 2012
Sold by
Zlatkas Inc
Bought by
Amcer Merriman Property Llc
Purchase Details
Closed on
Jan 29, 2002
Sold by
Fbs Properties
Bought by
Bobroff Harold
Purchase Details
Closed on
Jan 25, 2001
Sold by
Regal Liquor & Food Mark
Bought by
Michigan National Bank
Purchase Details
Closed on
Jul 13, 2000
Sold by
Regal Liquor & Food Mark
Bought by
Michigan National Bank
Purchase Details
Closed on
Feb 3, 1999
Sold by
F B S Properties
Bought by
Regal Liquor & Food Market Inc
Create a Home Valuation Report for This Property
The Home Valuation Report is an in-depth analysis detailing your home's value as well as a comparison with similar homes in the area
Home Values in the Area
Average Home Value in this Area
Purchase History
| Date | Buyer | Sale Price | Title Company |
|---|---|---|---|
| Westminster Development Llc | -- | First American Title | |
| Amcer Merriman Property Llc | -- | First American Title Ins Co | |
| West On West Llc | $923,000 | First American Title Ins Co | |
| Amcer Merriman Property Llc | $150,000 | William T Sheahan Title Co | |
| Amcer Properties Llc | -- | None Available | |
| Bobroff Harold | -- | -- | |
| Michigan National Bank | -- | -- | |
| Michigan National Bank | $349,125 | -- | |
| Regal Liquor & Food Market Inc | $150,000 | -- |
Source: Public Records
Tax History Compared to Growth
Tax History
| Year | Tax Paid | Tax Assessment Tax Assessment Total Assessment is a certain percentage of the fair market value that is determined by local assessors to be the total taxable value of land and additions on the property. | Land | Improvement |
|---|---|---|---|---|
| 2025 | $14,183 | $258,300 | $0 | $0 |
| 2024 | $14,183 | $253,200 | $0 | $0 |
| 2023 | $13,533 | $229,100 | $0 | $0 |
| 2022 | $14,648 | $218,500 | $0 | $0 |
| 2021 | $11,694 | $209,500 | $0 | $0 |
| 2020 | $11,571 | $208,600 | $0 | $0 |
| 2019 | $11,220 | $206,500 | $0 | $0 |
| 2018 | $9,336 | $207,200 | $0 | $0 |
| 2017 | $2,636 | $199,800 | $0 | $0 |
| 2016 | $10,831 | $164,700 | $0 | $0 |
| 2015 | $15,773 | $160,940 | $0 | $0 |
| 2013 | $16,060 | $164,340 | $0 | $0 |
| 2012 | $5,389 | $162,100 | $0 | $0 |
Source: Public Records
Map
Nearby Homes
- 30779 Middlebury St
- 31842 Bay Ct
- 30828 Parkwood St
- 30805 Parkwood St
- 31820 Bay Ct
- 1682 Beatrice St
- 31784 Arenac Ct
- 31923 Calhoun Ct
- 31606 Fairchild St
- 32046 Cheboygan Ct
- 32155 Melton St
- 32154 Melton St
- 1351 Mar Ann Dr
- 32116 Palmer Rd
- 32140 Palmer Rd
- 31913 Roscommon St
- 31203 Birchwood St
- 30270 Spring Arbor Dr
- 30817 Birchwood Ave
- 0 Henry Ruff Rd Unit 25008926
- 1630 Woodbourne St
- 1642 Woodbourne St
- VL Merriman St
- 1654 Woodbourne St
- 1618 Woodbourne St
- 1666 Woodbourne St
- 1606 Woodbourne St
- lot 63 Barrington
- lot 66 Barrington
- 1584 Woodbourne St
- 1678 Woodbourne St
- 1572 Woodbourne St
- 1604 S Merriman Rd
- 1530 Merriman Rd
- 1530 S Merriman Rd
- 1560 Woodbourne St
- 1663 S Merriman Rd
- 1639 Woodbourne St
- 1627 Woodbourne St
- 1653 Woodbourne St