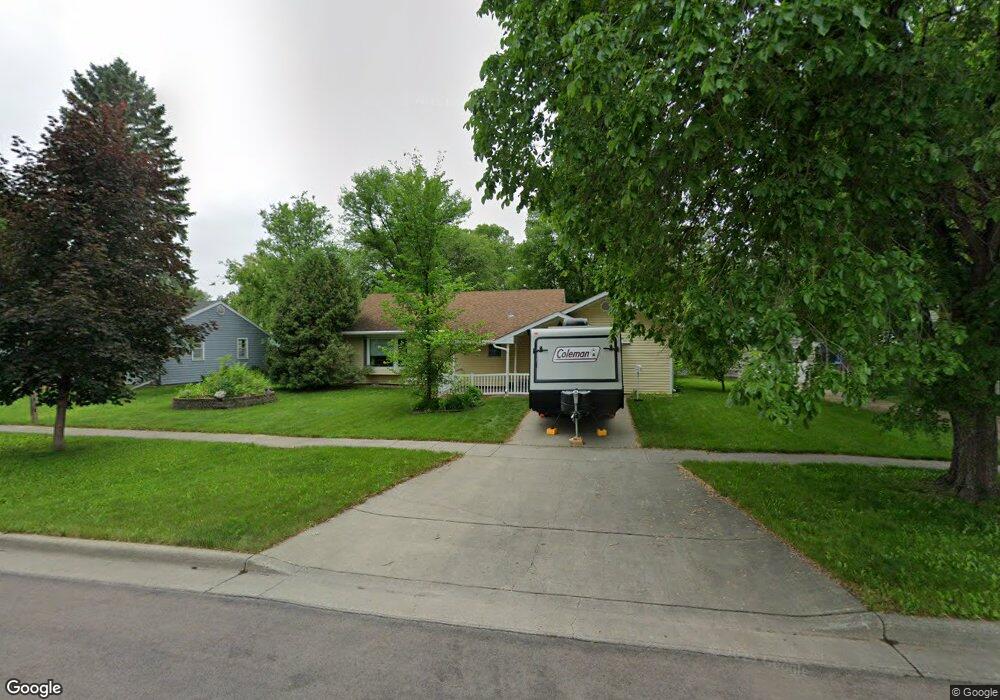
1616 2nd St N Fargo, ND 58102
Washington NeighborhoodEstimated Value: $281,000 - $338,248
4
Beds
3
Baths
2,700
Sq Ft
$112/Sq Ft
Est. Value
About This Home
This home is located at 1616 2nd St N, Fargo, ND 58102 and is currently estimated at $301,562, approximately $111 per square foot. 1616 2nd St N is a home located in Cass County with nearby schools including Washington Elementary School, Ben Franklin Middle School, and North High School.
Ownership History
Date
Name
Owned For
Owner Type
Purchase Details
Closed on
Oct 22, 2019
Sold by
Varholdt Jameson S and Varholdt Del Rio
Bought by
Kacer James T and Kacer Katherine J
Current Estimated Value
Home Financials for this Owner
Home Financials are based on the most recent Mortgage that was taken out on this home.
Original Mortgage
$210,614
Outstanding Balance
$186,171
Interest Rate
3.95%
Mortgage Type
FHA
Estimated Equity
$115,391
Purchase Details
Closed on
Feb 26, 2016
Sold by
Cassella Shannon
Bought by
Varholdt Jameson S and Varholdt Lilian Alinda Del Rio De
Home Financials for this Owner
Home Financials are based on the most recent Mortgage that was taken out on this home.
Original Mortgage
$1,752,656
Interest Rate
3.92%
Mortgage Type
FHA
Create a Home Valuation Report for This Property
The Home Valuation Report is an in-depth analysis detailing your home's value as well as a comparison with similar homes in the area
Home Values in the Area
Average Home Value in this Area
Purchase History
| Date | Buyer | Sale Price | Title Company |
|---|---|---|---|
| Kacer James T | -- | Regency Title Inc | |
| Varholdt Jameson S | $178,500 | Title Co |
Source: Public Records
Mortgage History
| Date | Status | Borrower | Loan Amount |
|---|---|---|---|
| Open | Kacer James T | $210,614 | |
| Previous Owner | Varholdt Jameson S | $1,752,656 |
Source: Public Records
Tax History Compared to Growth
Tax History
| Year | Tax Paid | Tax Assessment Tax Assessment Total Assessment is a certain percentage of the fair market value that is determined by local assessors to be the total taxable value of land and additions on the property. | Land | Improvement |
|---|---|---|---|---|
| 2024 | $4,340 | $149,650 | $36,000 | $113,650 |
| 2023 | $4,455 | $136,050 | $36,000 | $100,050 |
| 2022 | $4,274 | $127,150 | $36,000 | $91,150 |
| 2021 | $4,013 | $119,950 | $36,000 | $83,950 |
| 2020 | $3,821 | $114,250 | $36,000 | $78,250 |
| 2019 | $3,825 | $114,250 | $20,000 | $94,250 |
| 2018 | $3,473 | $102,250 | $20,000 | $82,250 |
| 2017 | $2,455 | $95,550 | $20,000 | $75,550 |
| 2016 | $2,047 | $86,850 | $20,000 | $66,850 |
| 2015 | $2,875 | $86,850 | $15,000 | $71,850 |
| 2014 | $2,972 | $88,450 | $15,000 | $73,450 |
| 2013 | $2,865 | $84,250 | $15,000 | $69,250 |
Source: Public Records
Map
Nearby Homes
- 1633 3rd St N
- 314 18th Ave N
- 1645 Broadway N
- 1822 3rd St N
- 1626 Broadway N
- 3216 Broadway N
- 1437 Broadway N Unit 102
- 305 19th Ave N
- 111 19th Ave N
- 1610 9th St N
- 1261 4th St N
- 1249 4th St N
- 1245 1st St N
- 1538 10th St N
- 207 23rd Ave N
- 1914 9th St N
- 1625 11th St N
- 917 14th Ave N
- 1316 8th St N
- 1346 9th St N