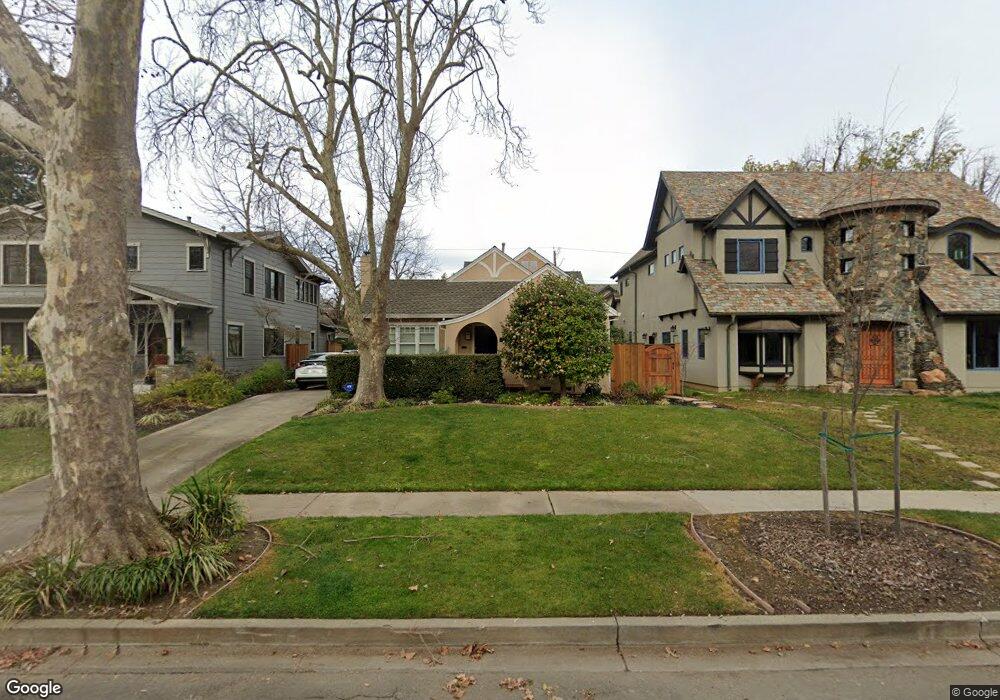
1616 38th St Sacramento, CA 95816
East Sacramento NeighborhoodEstimated Value: $913,000 - $1,202,000
3
Beds
2
Baths
2,451
Sq Ft
$407/Sq Ft
Est. Value
About This Home
This home is located at 1616 38th St, Sacramento, CA 95816 and is currently estimated at $997,510, approximately $406 per square foot. 1616 38th St is a home located in Sacramento County with nearby schools including David Lubin Elementary, Miwok Middle School, and Hiram W. Johnson High School.
Ownership History
Date
Name
Owned For
Owner Type
Purchase Details
Closed on
Mar 6, 2015
Sold by
Bushnell Diana J and Bushnell Thomas
Bought by
The Bushnell Family Living Trust
Current Estimated Value
Purchase Details
Closed on
Aug 18, 1999
Sold by
Bushnell Duana J
Bought by
Bushnell Thomas and Bushnell Diana J
Purchase Details
Closed on
Jul 19, 1999
Sold by
Kathrine M Jukich 1993 Trust and Kathrine M
Bought by
Bushnell Diana J
Create a Home Valuation Report for This Property
The Home Valuation Report is an in-depth analysis detailing your home's value as well as a comparison with similar homes in the area
Home Values in the Area
Average Home Value in this Area
Purchase History
We collect this data history from publicly available records. To have your information removed, we recommend requesting removal directly through your county’s website.
| Date | Buyer | Sale Price | Title Company |
|---|---|---|---|
| The Bushnell Family Living Trust | -- | None Available | |
| Bushnell Thomas | -- | Financial Title Company | |
| Bushnell Diana J | -- | -- |
Source: Public Records
Tax History
| Year | Tax Paid | Tax Assessment Tax Assessment Total Assessment is a certain percentage of the fair market value that is determined by local assessors to be the total taxable value of land and additions on the property. | Land | Improvement |
|---|---|---|---|---|
| 2025 | $4,268 | $366,240 | $54,403 | $311,837 |
| 2024 | $4,268 | $359,060 | $53,337 | $305,723 |
| 2023 | $4,166 | $352,021 | $52,292 | $299,729 |
| 2022 | $4,094 | $345,119 | $51,267 | $293,852 |
| 2021 | $3,898 | $338,353 | $50,262 | $288,091 |
| 2020 | $3,929 | $334,884 | $49,747 | $285,137 |
| 2019 | $3,845 | $328,319 | $48,772 | $279,547 |
| 2018 | $3,743 | $321,882 | $47,816 | $274,066 |
| 2017 | $3,690 | $315,572 | $46,879 | $268,693 |
| 2016 | $3,591 | $309,385 | $45,960 | $263,425 |
| 2015 | $3,537 | $304,739 | $45,270 | $259,469 |
| 2014 | $3,439 | $298,771 | $44,384 | $254,387 |
Source: Public Records
Map
Nearby Homes
Your Personal Tour Guide
Ask me questions while you tour the home.