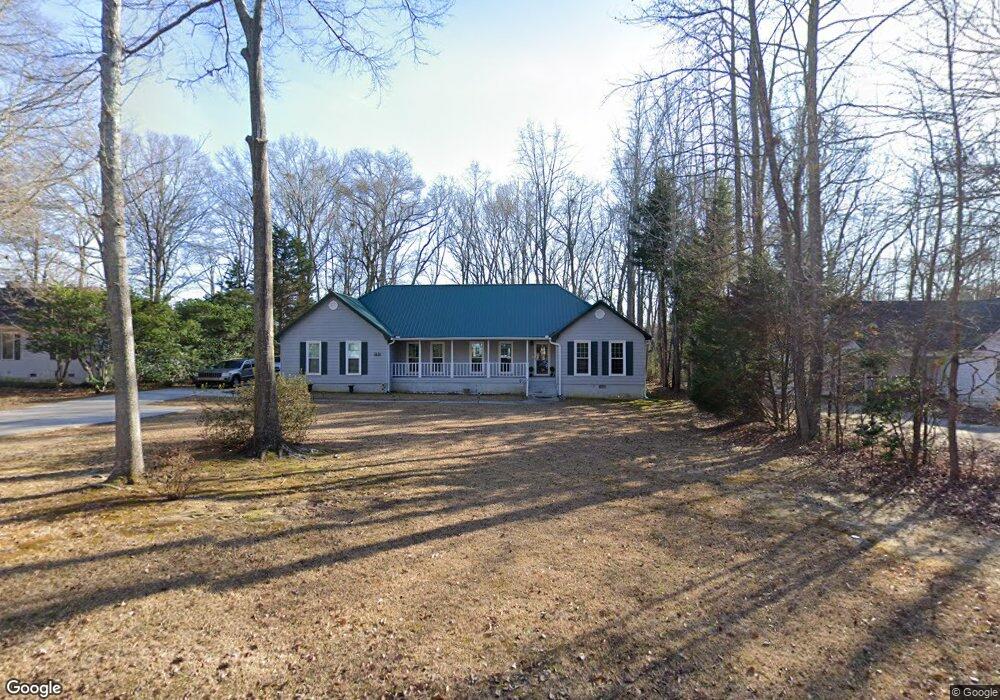
1616 Carriage Hills Dr Unit 2 Griffin, GA 30224
Spalding County NeighborhoodEstimated Value: $225,850 - $317,000
--
Bed
2
Baths
2,093
Sq Ft
$126/Sq Ft
Est. Value
About This Home
This home is located at 1616 Carriage Hills Dr Unit 2, Griffin, GA 30224 and is currently estimated at $263,213, approximately $125 per square foot. 1616 Carriage Hills Dr Unit 2 is a home located in Spalding County with nearby schools including Orrs Elementary School, Carver Road Middle School, and Griffin High School.
Ownership History
Date
Name
Owned For
Owner Type
Purchase Details
Closed on
Mar 14, 1997
Sold by
Chrismer David S
Bought by
Paulk Janet
Current Estimated Value
Home Financials for this Owner
Home Financials are based on the most recent Mortgage that was taken out on this home.
Original Mortgage
$99,750
Outstanding Balance
$12,042
Interest Rate
7.69%
Mortgage Type
New Conventional
Estimated Equity
$251,171
Purchase Details
Closed on
Aug 31, 1994
Sold by
Natl Mort Invest
Bought by
Chrismer David
Home Financials for this Owner
Home Financials are based on the most recent Mortgage that was taken out on this home.
Original Mortgage
$91,155
Interest Rate
8.44%
Mortgage Type
FHA
Purchase Details
Closed on
Jun 7, 1994
Sold by
House William Peggy
Bought by
Natl Mort Invest
Purchase Details
Closed on
Jul 18, 1989
Sold by
Maddox Joann W
Bought by
House William Anthony & Peggy P
Purchase Details
Closed on
Mar 23, 1989
Sold by
Landrum & Morris Inc
Bought by
Maddox Joann W
Create a Home Valuation Report for This Property
The Home Valuation Report is an in-depth analysis detailing your home's value as well as a comparison with similar homes in the area
Home Values in the Area
Average Home Value in this Area
Purchase History
| Date | Buyer | Sale Price | Title Company |
|---|---|---|---|
| Paulk Janet | $105,000 | -- | |
| Chrismer David | $92,000 | -- | |
| Natl Mort Invest | $13,400 | -- | |
| House William Anthony & Peggy P | $89,500 | -- | |
| Maddox Joann W | $14,100 | -- |
Source: Public Records
Mortgage History
| Date | Status | Borrower | Loan Amount |
|---|---|---|---|
| Open | Paulk Janet | $99,750 | |
| Previous Owner | Chrismer David | $91,155 |
Source: Public Records
Tax History Compared to Growth
Tax History
| Year | Tax Paid | Tax Assessment Tax Assessment Total Assessment is a certain percentage of the fair market value that is determined by local assessors to be the total taxable value of land and additions on the property. | Land | Improvement |
|---|---|---|---|---|
| 2024 | $3,251 | $87,434 | $9,200 | $78,234 |
| 2023 | $3,251 | $82,832 | $9,200 | $73,632 |
| 2022 | $2,755 | $71,294 | $8,000 | $63,294 |
| 2021 | $2,785 | $72,048 | $7,200 | $64,848 |
| 2020 | $2,010 | $52,655 | $7,200 | $45,455 |
| 2019 | $1,704 | $44,214 | $7,200 | $37,014 |
| 2018 | $1,702 | $42,650 | $7,200 | $35,450 |
| 2017 | $1,591 | $40,878 | $7,200 | $33,678 |
| 2016 | $1,154 | $29,834 | $7,200 | $22,634 |
| 2015 | $1,172 | $29,834 | $7,200 | $22,634 |
| 2014 | $1,207 | $29,834 | $7,200 | $22,634 |
Source: Public Records
Map
Nearby Homes
- 1740 Summerwoods Ln
- 450 Carver
- 1611 Piedmont Rd
- 424 S Pine Hill Rd Unit 1
- 1663 Piedmont Rd
- 1723 Carrington Dr
- 1721 Carrington Dr
- 1707 Carrington Dr
- 1705 Carrington Dr
- 1169 W Poplar St
- 1850 Carrington Dr
- 203 Ashley Dr
- 450 Carver Rd
- 1610 Williamson Rd
- 117 Mixon St
- 711 S Pine Hill Rd
- 1326 Oakdale Dr
- 733 S Pine Hill Rd
- TRACT A Newnan Rd
- 1776 Cheryl Ave
- 1618 Carriage Hills Dr
- 1614 Carriage Hills Dr
- 1612 Carriage Hills Dr
- 104 Carriage Trace
- 104 Carriage Trace Unit 2
- 1733 Summerwoods Ln
- 1735 Summerwoods Ln
- 1731 Summerwoods Ln
- 1737 Summerwoods Ln Unit 1737
- 1615 Carriage Hills Dr
- 1617 Carriage Hills Dr
- 1739 Summerwoods Ln
- 1729 Summerwoods Ln
- 106 Carriage Trace Unit 12
- 106 Carriage Trace
- 1741 Summerwoods Ln
- 1610 Carriage Hills Dr
- 1743 Summerwoods Ln
- 1727 Summerwoods Ln
- 1611 Carriage Hills Dr