1616 Farmers Rd Burlington, TX 76519
Estimated payment $3,194/month
About This Lot
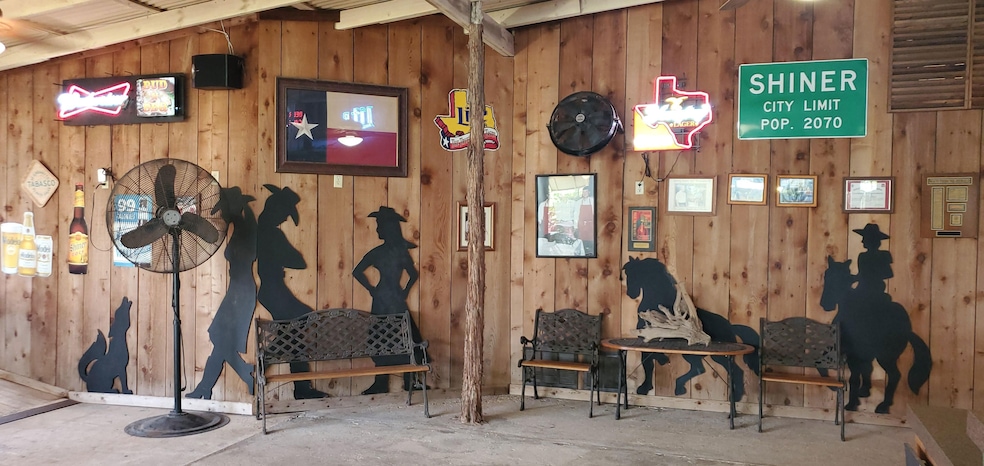
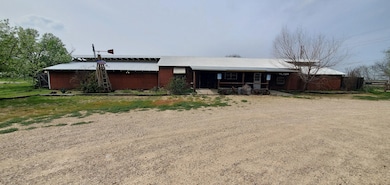
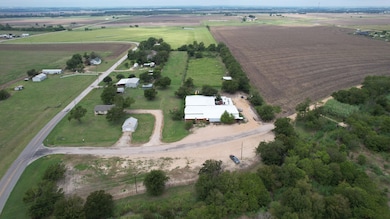
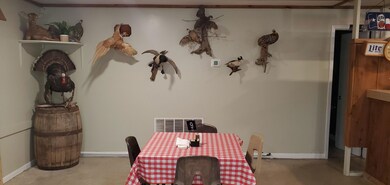
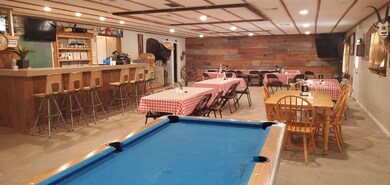
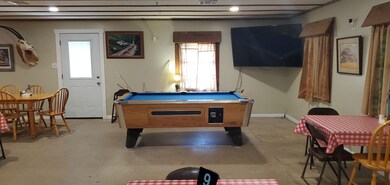
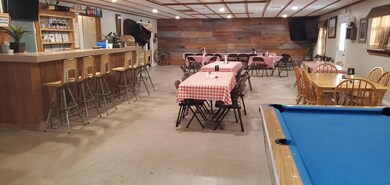
Turn-key Central Texas BBQ Restaurant with 40+ Year History Available for Sale. 1,836SF of Restaurant, Kitchen & Indoor Dining/Bar area. 3.23 Acre Restaurant Site, with additional 1.089 Acre Graveled Parking. Large Pit Area, 6,600+SF of Covered Outdoor Dining. Indoor/Outdoor Dining, Indoor/Outdoor Kitchen. Located between Temple & Rogers in East Bell County. Includes all Real Estate + Business + FFE & Inventory. Real & Personal Property Taxes: $6,066.89 (2025).
Listing Agent
Jeremy CCIM
JIRASEK REALTY, LLC License #9010446 Listed on: 09/12/2025

Property Details
Property Type
- Land
Est. Annual Taxes
- $5,046
Lot Details
- Property fronts a county road
- Current uses include commercial
- Potential uses include commercial
Location
- Outside City Limits
Utilities
- Co-Op Water
- Septic Tank
Map
Home Values in the Area
Average Home Value in this Area
Tax History
| Year | Tax Paid | Tax Assessment Tax Assessment Total Assessment is a certain percentage of the fair market value that is determined by local assessors to be the total taxable value of land and additions on the property. | Land | Improvement |
|---|---|---|---|---|
| 2025 | $5,046 | $345,294 | $164,142 | $181,152 |
| 2024 | $5,046 | $345,919 | $164,142 | $181,777 |
| 2023 | $4,195 | $292,662 | $114,957 | $177,705 |
| 2022 | $3,990 | $246,517 | $105,617 | $140,900 |
| 2021 | $2,844 | $170,499 | $29,599 | $140,900 |
| 2020 | $2,792 | $161,959 | $29,599 | $132,360 |
| 2019 | $2,491 | $136,341 | $29,599 | $106,742 |
| 2018 | $2,049 | $112,016 | $26,898 | $85,118 |
| 2017 | $2,006 | $106,255 | $22,239 | $84,016 |
| 2016 | $1,918 | $101,595 | $17,579 | $84,016 |
| 2014 | -- | $93,222 | $0 | $0 |
Property History
| Date | Event | Price | List to Sale | Price per Sq Ft |
|---|---|---|---|---|
| 09/12/2025 09/12/25 | For Sale | $525,000 | -- | -- |
Purchase History
| Date | Type | Sale Price | Title Company |
|---|---|---|---|
| Vendors Lien | -- | None Available |
Mortgage History
| Date | Status | Loan Amount | Loan Type |
|---|---|---|---|
| Open | $200,000 | Commercial |
- 18543 Cyclone Branch Rd
- 19081 Cyclone Branch Rd
- 17179 Cyclone Rd
- TBD TR2 Texas 53
- 19707 Fm 485
- 19855 Fm 485 Hwy
- 19845 Fm 485 Hwy
- 2228 Fm 437
- 876 S St Joseph Rd
- TBD Texas 53
- TBD N Elm Loop
- 20474
- TBD Rosebud Rd
- 0 Rosebud Rd
- Tract 3C Airville Rd
- Tract 4 Airville Rd
- TBD Airville Rd
- 310 Hruskaville Rd
- 565 Fm 1772
- 916 Stone Rd
- 1825 Hruskaville Rd
- 113 Thomas St
- 107 Thomas St
- 2929 Quail Rdg Ln Unit B
- 2913 Quail Ridge Ln Unit A
- 2913 Quail Ridge Ln Unit B
- 101 S 50th St Unit ID1324867P
- 207 Riptide Rd
- 202 Riptide Rd Unit A
- 1116 Coriander Rd
- 306 W Avenue D
- 2202 Wasabi Rd
- 3027 Dade Loop
- 1911 Meridian Loop
- 3705 Dogwood Ln
- 805 S 32nd St
- 1772 Lummus Dr
- 2787 S Martin Luther King jr Dr
- 1913 Zabcikville Dr
- 1418 Eaton Dr