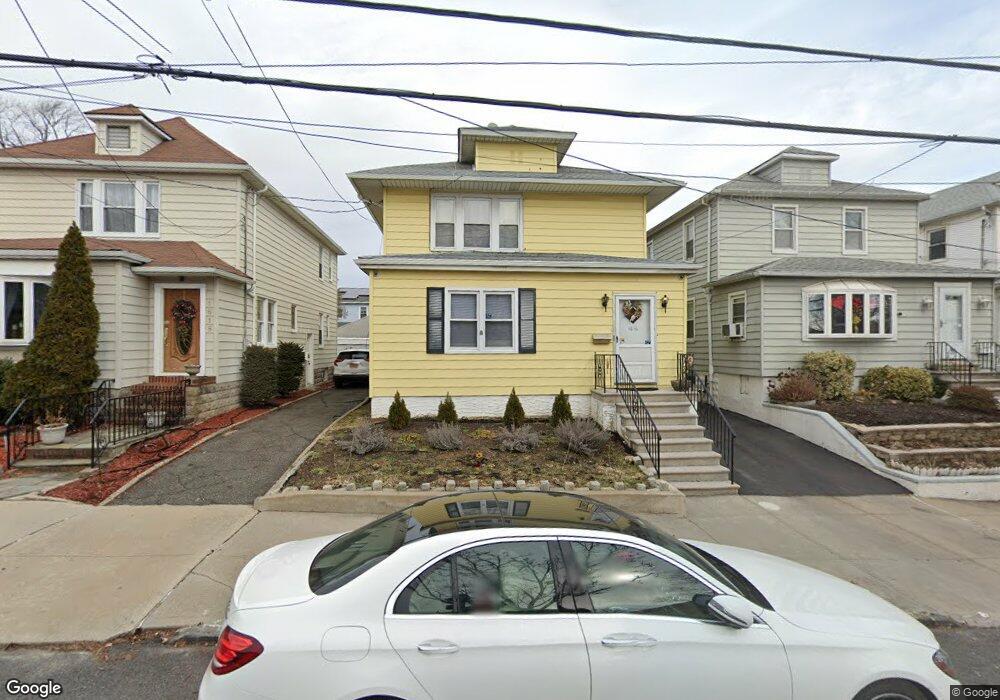
1616 Lurting Ave Unit 2 Bronx, NY 10461
Morris Park NeighborhoodEstimated Value: $843,000 - $992,000
About This Home
This home is located at 1616 Lurting Ave Unit 2, Bronx, NY 10461 and is currently estimated at $921,162, approximately $755 per square foot. 1616 Lurting Ave Unit 2 is a home located in Bronx County with nearby schools including P.S. 108 Philip J Abinanti, J.H.S. 144 Michelangelo, and Emblaze Academy Charter School.
Ownership History
We collect this data history from publicly available records. To have your information removed, we recommend requesting removal directly through your county’s website.
Purchase Details
Home Financials for this Owner
Home Financials are based on the most recent Mortgage that was taken out on this home.Purchase Details
Purchase Details
Home Values in the Area
Average Home Value in this Area
Purchase History
We collect this data history from publicly available records. To have your information removed, we recommend requesting removal directly through your county’s website.
| Date | Buyer | Sale Price | Title Company |
|---|---|---|---|
| $580,000 | -- | ||
| $580,000 | -- | ||
| -- | -- | ||
| -- | -- | ||
| -- | -- | ||
| -- | -- |
Mortgage History
We collect this data history from publicly available records. To have your information removed, we recommend requesting removal directly through your county’s website.
| Date | Status | Borrower | Loan Amount |
|---|---|---|---|
| Open | $464,000 | ||
| Closed | $464,000 |
Tax History
We collect this data history from publicly available records. To have your information removed, we recommend requesting removal directly through your county’s website.
| Year | Tax Paid | Tax Assessment Tax Assessment Total Assessment is a certain percentage of the fair market value that is determined by local assessors to be the total taxable value of land and additions on the property. | Land | Improvement |
|---|---|---|---|---|
| 2026 | $7,247 | $38,244 | $9,110 | $29,134 |
| 2025 | $6,837 | $36,080 | $8,086 | $27,994 |
| 2024 | $6,837 | $34,038 | $7,844 | $26,194 |
| 2023 | $6,913 | $34,038 | $7,810 | $26,228 |
| 2022 | $6,557 | $46,560 | $12,720 | $33,840 |
| 2021 | $6,707 | $40,800 | $12,720 | $28,080 |
| 2020 | $6,364 | $41,760 | $12,720 | $29,040 |
| 2019 | $5,934 | $35,340 | $12,720 | $22,620 |
| 2018 | $5,782 | $28,365 | $10,476 | $17,889 |
| 2017 | $5,579 | $27,370 | $10,288 | $17,082 |
| 2016 | $5,309 | $26,558 | $9,353 | $17,205 |
| 2015 | $2,393 | $25,056 | $11,847 | $13,209 |
| 2014 | $2,393 | $23,638 | $9,902 | $13,736 |
Map
- 1087 Pierce Ave
- 1629 Haight Ave
- 1644 Lurting Ave
- 1588 Hone Ave
- 1639 Hone Ave
- 1038 Pierce Ave
- 1003 Sackett Ave
- 1620 Radcliff Ave
- 1718 Williamsbridge Rd
- 1730 Colden Ave
- 976 Sackett Ave
- 1715 Hering Ave
- 1631 Bogart Ave
- 1831 Paulding Ave
- 1714 Saint Peters Ave
- 1844 Tomlinson Ave
- 1830 Yates Ave
- 1843 Yates Ave
- 1715 Saint Peters Ave
- 1863 Williamsbridge Rd
- 1616 Lurting Ave
- 1618 Lurting Ave
- 1612 Lurting Ave
- 1624 Lurting Ave
- 1610 Lurting Ave
- 1626 Lurting Ave Unit 1
- 1628 Lurting Ave
- 1615 Haight Ave
- 1613 Haight Ave
- 1621 Haight Ave
- 1611 Haight Ave
- 1611 Haight Ave Unit 1
- 1611 Haight Ave Unit 3
- 1079 Pierce Ave
- 1602 Lurting Ave
- 1081 Pierce Ave
- 1623 Haight Ave
- 1630 Lurting Ave
- 1625 Haight Ave
- 1617 Lurting Ave
Ask me questions while you tour the home.