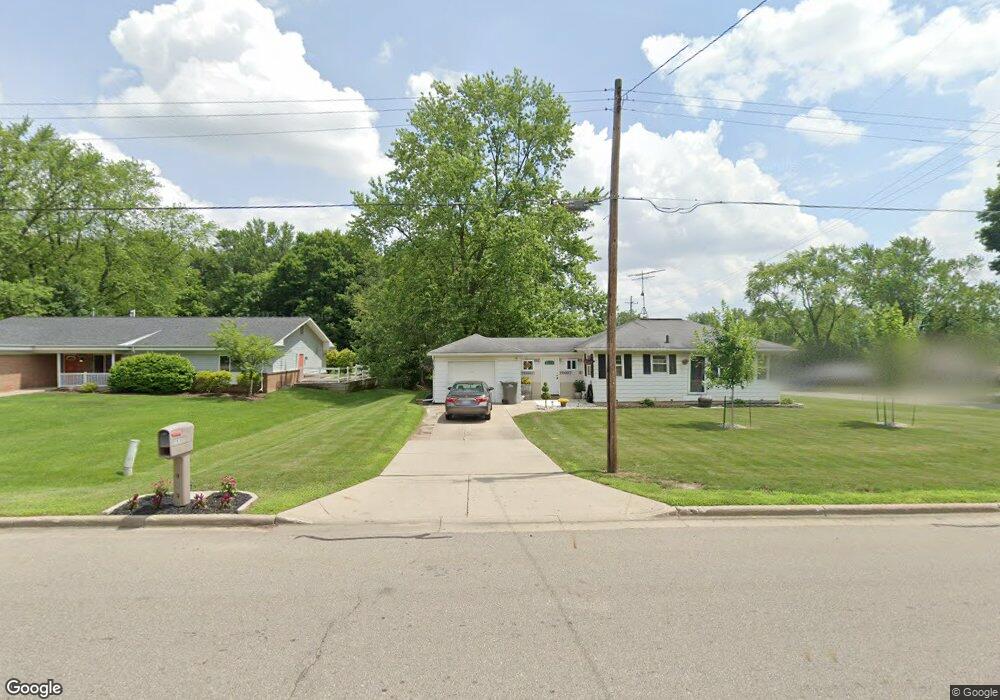
1616 Mullins Ave NW Grand Rapids, MI 49534
Estimated Value: $242,459 - $289,000
2
Beds
1
Bath
900
Sq Ft
$291/Sq Ft
Est. Value
About This Home
This home is located at 1616 Mullins Ave NW, Grand Rapids, MI 49534 and is currently estimated at $261,615, approximately $290 per square foot. 1616 Mullins Ave NW is a home located in Kent County with nearby schools including Kenowa Hills Central Elementary School, Kenowa Hills Middle School, and Kenowa Hills High School.
Ownership History
Date
Name
Owned For
Owner Type
Purchase Details
Closed on
Mar 6, 2022
Sold by
Leonard Papes Andrew
Bought by
Papes Courtney Leigh and Papes Andrew Leonard
Current Estimated Value
Purchase Details
Closed on
May 17, 2013
Sold by
Breeman Kimberly A
Bought by
Papes Andrew L
Home Financials for this Owner
Home Financials are based on the most recent Mortgage that was taken out on this home.
Original Mortgage
$78,542
Interest Rate
3.87%
Mortgage Type
FHA
Purchase Details
Closed on
Jun 2, 2006
Sold by
Bont Bridget and Aleksynas Bridget G
Bought by
Breeman Kimberly A
Home Financials for this Owner
Home Financials are based on the most recent Mortgage that was taken out on this home.
Original Mortgage
$20,000
Interest Rate
6.66%
Mortgage Type
Stand Alone Second
Purchase Details
Closed on
Nov 7, 1997
Sold by
Rongetti Philomena
Bought by
Aleksynas Bridget G and Papes Andrew
Create a Home Valuation Report for This Property
The Home Valuation Report is an in-depth analysis detailing your home's value as well as a comparison with similar homes in the area
Home Values in the Area
Average Home Value in this Area
Purchase History
| Date | Buyer | Sale Price | Title Company |
|---|---|---|---|
| Papes Courtney Leigh | -- | None Listed On Document | |
| Papes Andrew L | $80,000 | Sun Title Agency Of Mi Llc | |
| Breeman Kimberly A | $99,900 | Keystone Lighthouse Title In | |
| Aleksynas Bridget G | $64,000 | -- |
Source: Public Records
Mortgage History
| Date | Status | Borrower | Loan Amount |
|---|---|---|---|
| Previous Owner | Papes Andrew L | $78,542 | |
| Previous Owner | Breeman Kimberly A | $20,000 | |
| Previous Owner | Breeman Kimberly A | $79,900 |
Source: Public Records
Tax History Compared to Growth
Tax History
| Year | Tax Paid | Tax Assessment Tax Assessment Total Assessment is a certain percentage of the fair market value that is determined by local assessors to be the total taxable value of land and additions on the property. | Land | Improvement |
|---|---|---|---|---|
| 2025 | $1,301 | $95,300 | $0 | $0 |
| 2024 | $1,301 | $77,900 | $0 | $0 |
| 2023 | $1,220 | $71,900 | $0 | $0 |
| 2022 | $1,283 | $62,700 | $0 | $0 |
| 2021 | $1,251 | $60,300 | $0 | $0 |
| 2020 | $1,098 | $58,600 | $0 | $0 |
| 2019 | $2,063 | $54,200 | $0 | $0 |
| 2018 | $1,187 | $49,800 | $0 | $0 |
| 2017 | $1,154 | $44,500 | $0 | $0 |
| 2016 | $1,109 | $42,800 | $0 | $0 |
| 2015 | $1,047 | $42,800 | $0 | $0 |
| 2013 | -- | $37,900 | $0 | $0 |
Source: Public Records
Map
Nearby Homes
- 1596 Geddes Ave NW
- 1781 Mullins Ave NW
- 1733 Whitmore Ave NW
- 3120 Richmond St NW
- 3560 Richmond St NW
- 3080 Richmond St NW
- 1289 Lancaster Ave NW
- 1300 Lancaster Ave NW
- 1524 Stark Ave NW
- 1302 Hillburn Ave NW
- 958 Maynard Ave NW
- 1270 Hillburn Ave NW Unit 35
- 960 Brownwood Ave NW
- 3518 Sunrise Ln NW
- 3238 Cassandra St NW
- 2140 Kinney Ave NW
- 2220 Elmridge Dr NW
- 1217 El Camino Dr NW
- 1537 Browning Dr
- 1092 Kensington St NW Unit 42
- 1630 Mullins Ave NW
- 3359 Milo St NW
- 3394 Milo St NW
- 3370 Milo St NW
- 1644 Mullins Ave NW
- 1587 Mullins Ave NW
- 1615 Mullins Ave NW
- 1568 Mullins Ave NW
- 1631 Mullins Ave NW
- 1575 Mullins Ave NW
- 931935 Kusterer Dr NW
- 1571 Marlin Ave NW
- 1656 Mullins Ave NW
- 3340 Milo St NW
- 3416 Bonisteel NW
- 3355 Milo St NW
- 3424 Bonisteel NW
- 1559 Mullins Ave NW
- 1622 Geddes Ave NW
- 1570 Marlin Ave NW