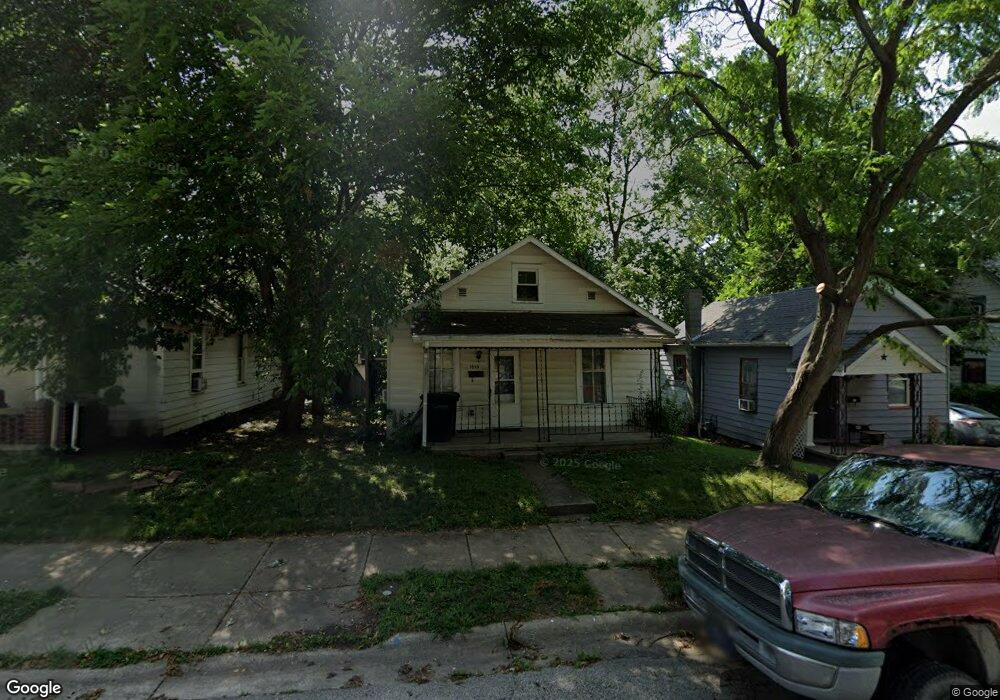
1616 N 12th St Lafayette, IN 47904
Monon NeighborhoodEstimated Value: $94,000 - $184,000
2
Beds
1
Bath
1,768
Sq Ft
$89/Sq Ft
Est. Value
About This Home
This home is located at 1616 N 12th St, Lafayette, IN 47904 and is currently estimated at $157,649, approximately $89 per square foot. 1616 N 12th St is a home located in Tippecanoe County with nearby schools including Vinton Elementary School, Sunnyside Intermediate School, and Lafayette Tecumseh Junior High School.
Ownership History
Date
Name
Owned For
Owner Type
Purchase Details
Closed on
Jul 28, 2010
Sold by
Park Tree Investments Iii Llc
Bought by
Cool Todd R
Current Estimated Value
Purchase Details
Closed on
Jun 10, 2010
Sold by
Neighborhood Housing Services Of America
Bought by
Park Tree Investments Iii Llc
Purchase Details
Closed on
Apr 9, 2010
Sold by
Boorom Brenda S
Bought by
Neighborhood Housing Services Of America
Purchase Details
Closed on
Aug 4, 2005
Sold by
Lafayette Neighborhood Housing Svcs Inc
Bought by
Boorom Brenda S
Home Financials for this Owner
Home Financials are based on the most recent Mortgage that was taken out on this home.
Original Mortgage
$66,600
Interest Rate
5.71%
Mortgage Type
Unknown
Purchase Details
Closed on
Aug 24, 2001
Sold by
Gass D Mike and Gass Angela M
Bought by
Lafayette Neighborhood Housing Svcs Inc
Create a Home Valuation Report for This Property
The Home Valuation Report is an in-depth analysis detailing your home's value as well as a comparison with similar homes in the area
Home Values in the Area
Average Home Value in this Area
Purchase History
| Date | Buyer | Sale Price | Title Company |
|---|---|---|---|
| Cool Todd R | -- | None Available | |
| Park Tree Investments Iii Llc | $24,000 | None Available | |
| Neighborhood Housing Services Of America | $72,487 | None Available | |
| Boorom Brenda S | -- | -- | |
| Lafayette Neighborhood Housing Svcs Inc | -- | -- |
Source: Public Records
Mortgage History
| Date | Status | Borrower | Loan Amount |
|---|---|---|---|
| Previous Owner | Boorom Brenda S | $66,600 |
Source: Public Records
Tax History Compared to Growth
Tax History
| Year | Tax Paid | Tax Assessment Tax Assessment Total Assessment is a certain percentage of the fair market value that is determined by local assessors to be the total taxable value of land and additions on the property. | Land | Improvement |
|---|---|---|---|---|
| 2024 | $1,001 | $125,700 | $13,000 | $112,700 |
| 2023 | $929 | $117,700 | $13,000 | $104,700 |
| 2022 | $784 | $99,900 | $13,000 | $86,900 |
| 2021 | $542 | $82,800 | $13,000 | $69,800 |
| 2020 | $424 | $73,200 | $13,000 | $60,200 |
| 2019 | $379 | $65,700 | $11,000 | $54,700 |
| 2018 | $390 | $65,700 | $11,000 | $54,700 |
| 2017 | $377 | $64,200 | $11,000 | $53,200 |
| 2016 | $356 | $62,000 | $11,000 | $51,000 |
| 2014 | $268 | $58,600 | $11,000 | $47,600 |
| 2013 | $250 | $56,000 | $11,000 | $45,000 |
Source: Public Records
Map
Nearby Homes
- 1411 N 14th St
- 1219 Roberts St
- 108 Barbee St
- 1000 Hartford St
- 1829 Greenbush St
- 1904 Greenbush St
- 1803 Pierce St
- 1029 N 7th St
- 802 Tippecanoe St
- 1925 Maple St
- 1931 Morton St
- 2022 Elk St
- 2127 Perrine St
- 2340 N 20th St
- 1109 Elizabeth St
- 416 Catherwood Dr
- 620 N 11th St Unit 22
- 1201 Cincinnati St
- 511 N 7th St
- 640 Perrin Ave