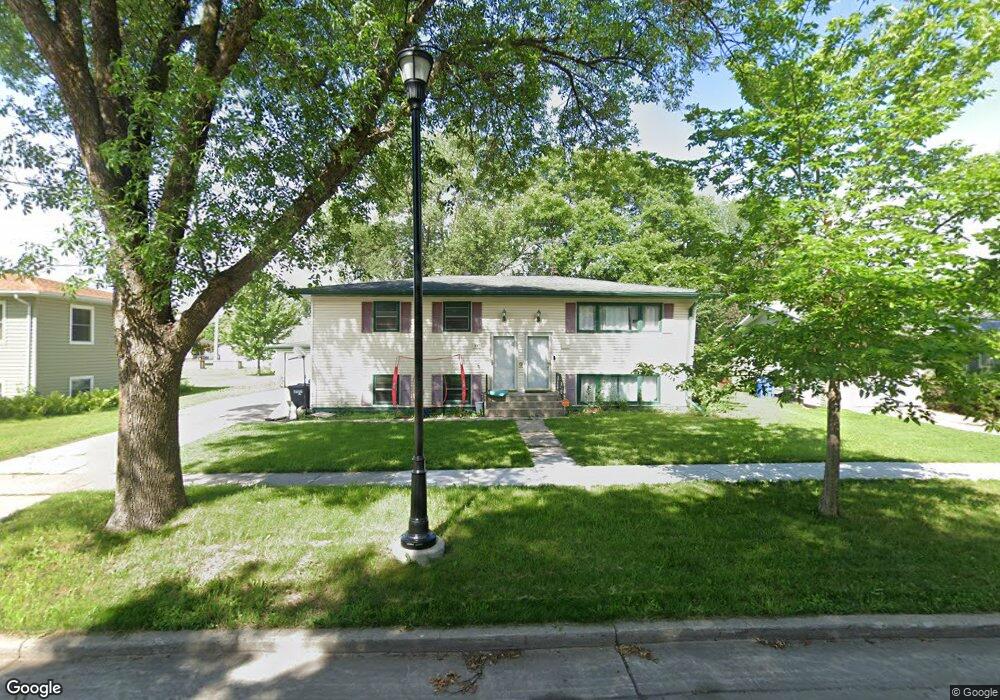
1617 16 1/2 St S Fargo, ND 58103
Lewis and Clark NeighborhoodEstimated Value: $249,000 - $294,010
5
Beds
2
Baths
2,464
Sq Ft
$107/Sq Ft
Est. Value
About This Home
This home is located at 1617 16 1/2 St S, Fargo, ND 58103 and is currently estimated at $264,003, approximately $107 per square foot. 1617 16 1/2 St S is a home located in Cass County with nearby schools including Lewis & Clark Elementary School, Carl Ben Eielson Middle School, and South High School.
Ownership History
Date
Name
Owned For
Owner Type
Purchase Details
Closed on
Jan 10, 2023
Sold by
Halvorson Barry and Halvorson Theresa
Bought by
Barrera Erik A and Barrera Crystal A
Current Estimated Value
Home Financials for this Owner
Home Financials are based on the most recent Mortgage that was taken out on this home.
Original Mortgage
$249,399
Outstanding Balance
$241,262
Interest Rate
6.49%
Mortgage Type
FHA
Estimated Equity
$22,741
Purchase Details
Closed on
Sep 29, 2017
Sold by
Johnson Andrew and Johnson Emilie M
Bought by
A & E Johnson Llc
Purchase Details
Closed on
May 19, 2014
Sold by
The Bank Of New York Mellon
Bought by
Johnson Andrew
Purchase Details
Closed on
May 9, 2014
Sold by
Edwards Colleen Y
Bought by
The Bank Of New York Mellon and The Bank Of New York
Purchase Details
Closed on
Oct 7, 2005
Sold by
Johnson Bryan L
Bought by
Edwards Colleen Y
Home Financials for this Owner
Home Financials are based on the most recent Mortgage that was taken out on this home.
Original Mortgage
$126,650
Interest Rate
11.6%
Mortgage Type
Adjustable Rate Mortgage/ARM
Create a Home Valuation Report for This Property
The Home Valuation Report is an in-depth analysis detailing your home's value as well as a comparison with similar homes in the area
Home Values in the Area
Average Home Value in this Area
Purchase History
| Date | Buyer | Sale Price | Title Company |
|---|---|---|---|
| Barrera Erik A | $254,000 | The Title Company | |
| A & E Johnson Llc | -- | Clay Co Abstract | |
| Johnson Andrew | $105,300 | Grand Forks Abstract & Title | |
| The Bank Of New York Mellon | -- | None Available | |
| Edwards Colleen Y | -- | -- |
Source: Public Records
Mortgage History
| Date | Status | Borrower | Loan Amount |
|---|---|---|---|
| Open | Barrera Erik A | $249,399 | |
| Previous Owner | Edwards Colleen Y | $126,650 |
Source: Public Records
Tax History Compared to Growth
Tax History
| Year | Tax Paid | Tax Assessment Tax Assessment Total Assessment is a certain percentage of the fair market value that is determined by local assessors to be the total taxable value of land and additions on the property. | Land | Improvement |
|---|---|---|---|---|
| 2024 | $3,175 | $120,950 | $29,000 | $91,950 |
| 2023 | $3,658 | $120,950 | $29,000 | $91,950 |
| 2022 | $3,218 | $109,950 | $29,000 | $80,950 |
| 2021 | $2,847 | $98,050 | $30,250 | $67,800 |
| 2020 | $2,607 | $89,150 | $30,250 | $58,900 |
| 2019 | $2,192 | $83,300 | $17,950 | $65,350 |
| 2018 | $2,164 | $83,300 | $17,950 | $65,350 |
| 2017 | $2,039 | $79,350 | $17,950 | $61,400 |
| 2016 | $1,816 | $77,050 | $17,950 | $59,100 |
| 2015 | $1,774 | $70,600 | $12,300 | $58,300 |
| 2014 | $1,582 | $61,400 | $12,300 | $49,100 |
| 2013 | $1,584 | $61,400 | $12,300 | $49,100 |
Source: Public Records
Map
Nearby Homes
- 1545 15th St S
- 1718 15th St S
- 1550 14 1 2 St S
- 1407 17th St S
- 1710 14th St S
- 1838 17th St S
- 1361 16th Ave S
- 1737 Park Blvd S
- 1410 14 1 2 St S
- 1550 13 1 2 St S
- 1834 14 1 2 St S
- 2202 15th Ave S
- 1725 Whitestone Cir S
- 1917 16 1 2 St S
- 1301 16 1 2 St S
- 1943 19th St S
- 1709 13th Ave S
- 2401 17th Ave S
- 2320 20th Ave S Unit 7
- 1314 14th St S
- 1617 16 1 2 St S
- 1621 16 1/2 St S
- 1611 16 1/2 St S
- 1605 16 1/2 St S
- 1625 16 1 2 St S
- 1605 16 1 2 St S
- 1625 16 1/2 St S
- 1618 16 1/2 St S
- 1618 16 1 2 St S
- 1622 16 1 2 St S
- 1614 16 1 2 St S
- 1614 17th St S
- 1618 17th St S
- 1622 16th Ave S
- 1622 16th Ave S Unit 1626
- 1610 17th St S
- 1622 16 1/2 St S
- 1622 17th St S
- 1614 16 1/2 St S
- 1606 17th St S