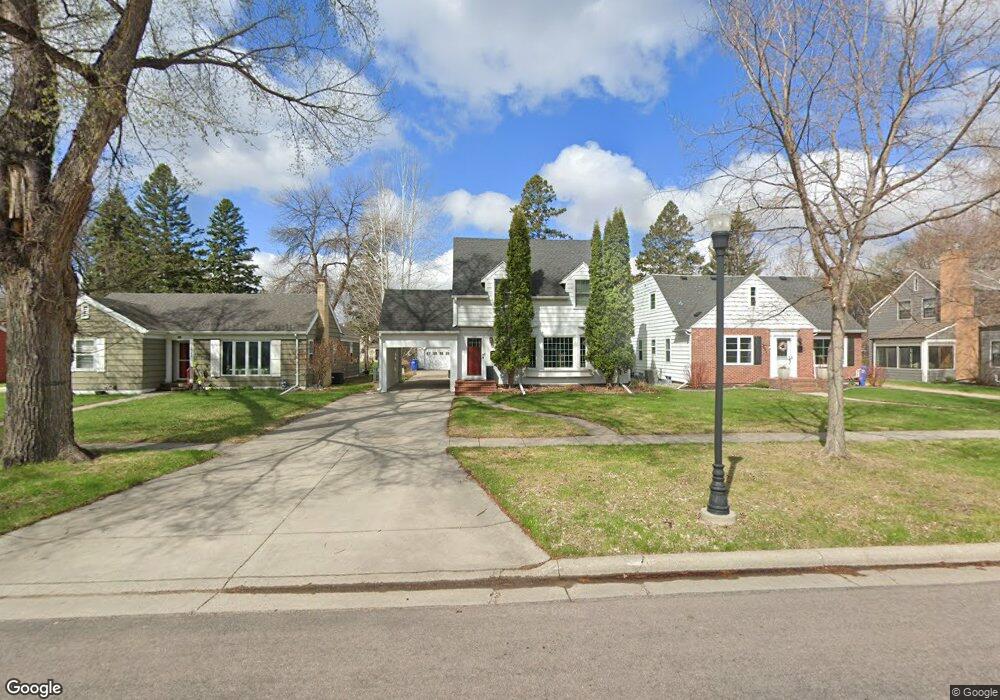
1617 9th St S Fargo, ND 58103
Clara Barton NeighborhoodEstimated Value: $451,000 - $585,000
4
Beds
3
Baths
3,042
Sq Ft
$162/Sq Ft
Est. Value
About This Home
This home is located at 1617 9th St S, Fargo, ND 58103 and is currently estimated at $492,147, approximately $161 per square foot. 1617 9th St S is a home located in Cass County with nearby schools including Clara Barton Elementary School, Carl Ben Eielson Middle School, and South High School.
Ownership History
Date
Name
Owned For
Owner Type
Purchase Details
Closed on
May 16, 2016
Sold by
Bello Mark S and Bello Rebecca Lynn
Bought by
Nichols Brent and Nichols Laura
Current Estimated Value
Home Financials for this Owner
Home Financials are based on the most recent Mortgage that was taken out on this home.
Original Mortgage
$340,800
Outstanding Balance
$150,631
Interest Rate
3.59%
Mortgage Type
New Conventional
Estimated Equity
$341,516
Purchase Details
Closed on
Aug 6, 2014
Sold by
Durbin Matthew A and Durbin Anne H
Bought by
Bello Mark S and Bello Rebecca Lynn
Home Financials for this Owner
Home Financials are based on the most recent Mortgage that was taken out on this home.
Original Mortgage
$295,920
Interest Rate
4.15%
Mortgage Type
New Conventional
Purchase Details
Closed on
Dec 30, 2005
Sold by
Haworth-Swanson Beverly J and Swanson Beverly H
Bought by
Durbin Matthew A and Durbin Anne H
Home Financials for this Owner
Home Financials are based on the most recent Mortgage that was taken out on this home.
Original Mortgage
$208,000
Interest Rate
6.48%
Mortgage Type
New Conventional
Create a Home Valuation Report for This Property
The Home Valuation Report is an in-depth analysis detailing your home's value as well as a comparison with similar homes in the area
Home Values in the Area
Average Home Value in this Area
Purchase History
| Date | Buyer | Sale Price | Title Company |
|---|---|---|---|
| Nichols Brent | $426,000 | Fm Title | |
| Bello Mark S | $369,900 | Title Co | |
| Durbin Matthew A | -- | -- |
Source: Public Records
Mortgage History
| Date | Status | Borrower | Loan Amount |
|---|---|---|---|
| Open | Nichols Brent | $340,800 | |
| Previous Owner | Bello Mark S | $295,920 | |
| Previous Owner | Durbin Matthew A | $208,000 |
Source: Public Records
Tax History
| Year | Tax Paid | Tax Assessment Tax Assessment Total Assessment is a certain percentage of the fair market value that is determined by local assessors to be the total taxable value of land and additions on the property. | Land | Improvement |
|---|---|---|---|---|
| 2024 | $6,167 | $210,050 | $40,100 | $169,950 |
| 2023 | $5,633 | $191,150 | $40,100 | $151,050 |
| 2022 | $5,617 | $187,450 | $40,100 | $147,350 |
| 2021 | $5,748 | $195,850 | $34,250 | $161,600 |
| 2020 | $4,762 | $160,950 | $34,250 | $126,700 |
| 2019 | $4,360 | $145,500 | $21,550 | $123,950 |
| 2018 | $4,310 | $145,500 | $21,550 | $123,950 |
| 2017 | $4,512 | $154,950 | $21,550 | $133,400 |
| 2016 | $4,076 | $150,450 | $21,550 | $128,900 |
| 2015 | $3,975 | $137,300 | $13,300 | $124,000 |
| 2014 | $3,741 | $124,800 | $13,300 | $111,500 |
| 2013 | $3,833 | $124,800 | $13,300 | $111,500 |
Source: Public Records
Map
Nearby Homes
Your Personal Tour Guide
Ask me questions while you tour the home.