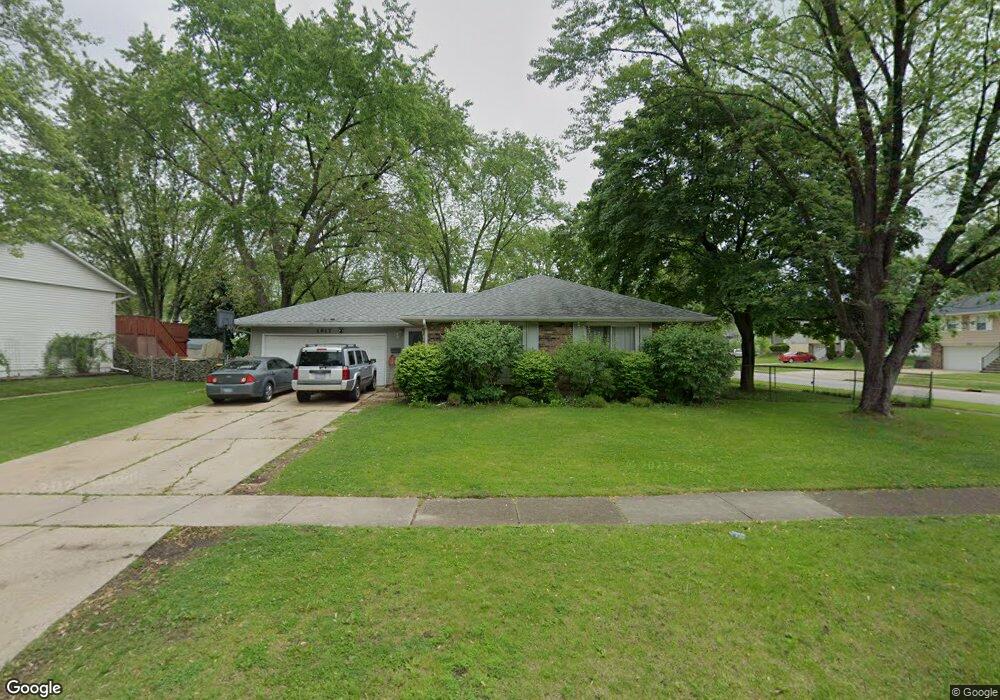
1617 Alexander Ave Streamwood, IL 60107
Woodland Heights NeighborhoodEstimated Value: $307,000 - $350,000
3
Beds
2
Baths
1,281
Sq Ft
$256/Sq Ft
Est. Value
About This Home
This home is located at 1617 Alexander Ave, Streamwood, IL 60107 and is currently estimated at $327,495, approximately $255 per square foot. 1617 Alexander Ave is a home located in Cook County with nearby schools including Parkwood Elementary School, Tefft Middle School, and Streamwood High School.
Ownership History
Date
Name
Owned For
Owner Type
Purchase Details
Closed on
Aug 30, 2006
Sold by
Goytia Jose V and Goyita Jose V
Bought by
Perez Jose Miguel and Perez Maria R
Current Estimated Value
Home Financials for this Owner
Home Financials are based on the most recent Mortgage that was taken out on this home.
Original Mortgage
$226,900
Outstanding Balance
$134,172
Interest Rate
6.77%
Mortgage Type
Unknown
Estimated Equity
$193,323
Purchase Details
Closed on
Mar 1, 2005
Sold by
Goytia Jose and Goytia Jesus
Bought by
Goyita Jose V
Purchase Details
Closed on
Sep 17, 1998
Sold by
Kizman Michael C and Kizman Wendy K
Bought by
Goytia Jose V and Goytia Jesus
Home Financials for this Owner
Home Financials are based on the most recent Mortgage that was taken out on this home.
Original Mortgage
$126,585
Interest Rate
6.99%
Mortgage Type
FHA
Create a Home Valuation Report for This Property
The Home Valuation Report is an in-depth analysis detailing your home's value as well as a comparison with similar homes in the area
Home Values in the Area
Average Home Value in this Area
Purchase History
| Date | Buyer | Sale Price | Title Company |
|---|---|---|---|
| Perez Jose Miguel | $227,000 | Git | |
| Goyita Jose V | -- | Cti | |
| Goytia Jose V | $127,500 | -- |
Source: Public Records
Mortgage History
| Date | Status | Borrower | Loan Amount |
|---|---|---|---|
| Open | Perez Jose Miguel | $226,900 | |
| Previous Owner | Goytia Jose V | $126,585 |
Source: Public Records
Tax History
| Year | Tax Paid | Tax Assessment Tax Assessment Total Assessment is a certain percentage of the fair market value that is determined by local assessors to be the total taxable value of land and additions on the property. | Land | Improvement |
|---|---|---|---|---|
| 2025 | $6,987 | $29,000 | $7,142 | $21,858 |
| 2024 | $6,987 | $26,001 | $5,102 | $20,899 |
| 2023 | $6,773 | $26,001 | $5,102 | $20,899 |
| 2022 | $6,773 | $26,001 | $5,102 | $20,899 |
| 2021 | $5,126 | $17,352 | $3,571 | $13,781 |
| 2020 | $5,121 | $17,352 | $3,571 | $13,781 |
| 2019 | $5,134 | $19,497 | $3,571 | $15,926 |
| 2018 | $5,025 | $17,702 | $3,060 | $14,642 |
| 2017 | $4,976 | $17,702 | $3,060 | $14,642 |
| 2016 | $4,925 | $17,702 | $3,060 | $14,642 |
| 2015 | $4,984 | $16,674 | $2,805 | $13,869 |
| 2014 | $4,928 | $16,674 | $2,805 | $13,869 |
| 2013 | $4,754 | $16,674 | $2,805 | $13,869 |
Source: Public Records
Map
Nearby Homes
- 805 Stowell Ave
- 413 Lacy Ave
- 1723 Mckool Ave
- 6881 Hickory St
- 2110 Cherry Ave
- 916 Mulberry Ln
- 55 King Dr
- 1005 Meadow Ln
- 1861 Hollywood Ave
- 377 Locksley Dr
- 110 N Chase Ave
- 179 Locksley Dr
- 334 Marcia Ct Unit C
- 128 Fairview Ln
- 1777 Linden Ave
- 132 Meredith Ln Unit 63
- 2074 Essex Ct Unit 2074
- 140 N Elroy Ave
- 195 Mary Ct Unit A
- 194 Robert Ct Unit A
- 1615 Alexander Ave
- 1612 Roder Ct
- 1613 Alexander Ave
- 1610 Roder Ct
- 703 Lacy Ave
- 1620 Alexander Ave
- 705 Lacy Ave
- 1618 Alexander Ave
- 701 Stowell Ave
- 707 Lacy Ave
- 1616 Alexander Ave
- 1608 Roder Ct
- 1611 Alexander Ave
- 709 Lacy Ave
- 1614 Alexander Ave
- 703 Stowell Ave
- 1606 Roder Ct
- 1609 Alexander Ave
- 705 Stowell Ave
- 1613 Roder Ct
Your Personal Tour Guide
Ask me questions while you tour the home.