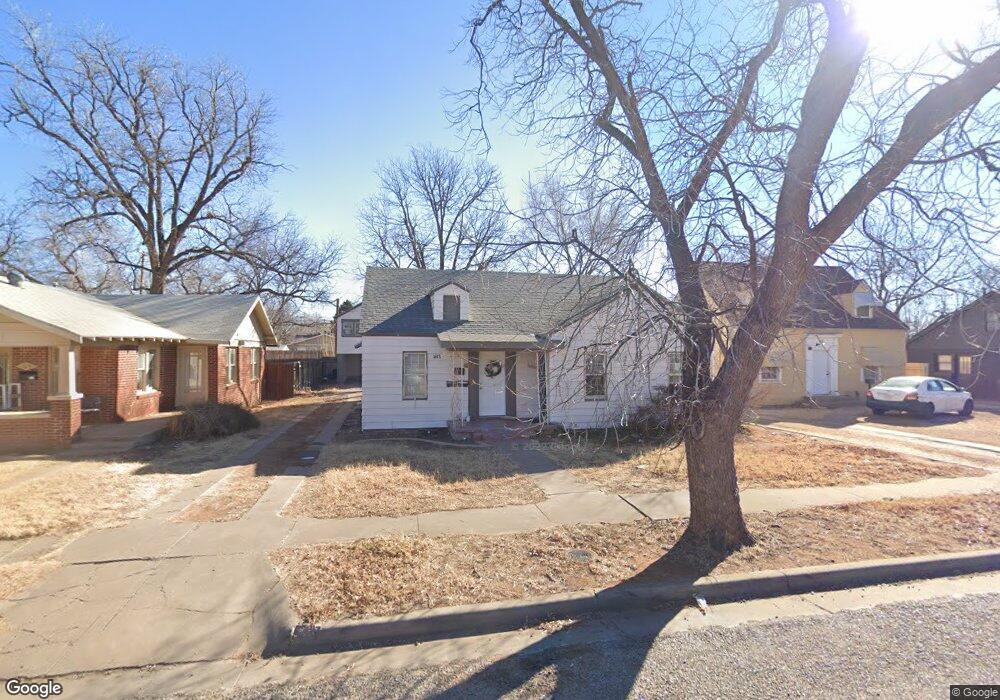
1617 Avenue Y Unit C Lubbock, TX 79401
South Overton NeighborhoodEstimated Value: $132,000 - $197,000
1
Bed
1
Bath
1,432
Sq Ft
$117/Sq Ft
Est. Value
About This Home
This home is located at 1617 Avenue Y Unit C, Lubbock, TX 79401 and is currently estimated at $166,987, approximately $116 per square foot. 1617 Avenue Y Unit C is a home located in Lubbock County with nearby schools including Ramirez Elementary School, Hutchinson Middle School, and Lubbock High School.
Ownership History
Date
Name
Owned For
Owner Type
Purchase Details
Closed on
Jun 16, 2023
Sold by
Wl Moyer Llc
Bought by
Aspen Collective Texas Llc
Current Estimated Value
Purchase Details
Closed on
Nov 10, 2022
Sold by
Kcap Re Fund Ii Llc
Bought by
Wl Moyer Llc
Purchase Details
Closed on
Aug 15, 2013
Sold by
Sterling Creek Ventures Llc
Bought by
Sterling Creek Property Solutions Llc
Purchase Details
Closed on
May 15, 2013
Sold by
Rrr Properties Llc
Bought by
Sterling Creek Ventures Llc
Home Financials for this Owner
Home Financials are based on the most recent Mortgage that was taken out on this home.
Original Mortgage
$95,000
Interest Rate
3.45%
Mortgage Type
Purchase Money Mortgage
Purchase Details
Closed on
Oct 26, 2007
Sold by
Payne Lester and Payne Pamela
Bought by
Rrr Properties Llc
Home Financials for this Owner
Home Financials are based on the most recent Mortgage that was taken out on this home.
Original Mortgage
$69,500
Interest Rate
6.26%
Mortgage Type
Seller Take Back
Create a Home Valuation Report for This Property
The Home Valuation Report is an in-depth analysis detailing your home's value as well as a comparison with similar homes in the area
Home Values in the Area
Average Home Value in this Area
Purchase History
| Date | Buyer | Sale Price | Title Company |
|---|---|---|---|
| Aspen Collective Texas Llc | -- | None Listed On Document | |
| Wl Moyer Llc | -- | -- | |
| Sterling Creek Property Solutions Llc | -- | -- | |
| Sterling Creek Ventures Llc | -- | Service Title | |
| Rrr Properties Llc | -- | None Available |
Source: Public Records
Mortgage History
| Date | Status | Borrower | Loan Amount |
|---|---|---|---|
| Previous Owner | Sterling Creek Ventures Llc | $95,000 | |
| Previous Owner | Rrr Properties Llc | $69,500 |
Source: Public Records
Tax History Compared to Growth
Tax History
| Year | Tax Paid | Tax Assessment Tax Assessment Total Assessment is a certain percentage of the fair market value that is determined by local assessors to be the total taxable value of land and additions on the property. | Land | Improvement |
|---|---|---|---|---|
| 2025 | $2,545 | $126,875 | $22,600 | $104,275 |
| 2024 | $2,545 | $140,135 | $22,600 | $117,535 |
| 2023 | $2,705 | $145,529 | $5,870 | $139,659 |
| 2022 | $2,750 | $135,851 | $5,870 | $129,981 |
| 2021 | $2,535 | $118,387 | $5,870 | $112,517 |
| 2020 | $2,183 | $100,407 | $5,870 | $94,537 |
| 2019 | $2,318 | $103,240 | $5,870 | $97,370 |
| 2018 | $2,321 | $103,240 | $5,870 | $97,370 |
| 2017 | $2,324 | $103,240 | $5,870 | $97,370 |
| 2016 | $2,080 | $92,422 | $5,870 | $86,552 |
| 2015 | $2,053 | $91,644 | $5,870 | $85,774 |
| 2014 | $2,053 | $92,312 | $2,024 | $90,288 |
Source: Public Records
Map
Nearby Homes
- 1617 Avenue Y
- 1619 Avenue Y
- 1615 Avenue Y
- 1613 Avenue Y
- 1613 Ave Y
- 1613 Ave Y Unit A
- 1613 Ave Y Unit B
- 1613 Ave Y Unit C
- 1613 Ave Y
- 1621 Avenue Y
- 1621 Avenue Y Unit C
- 1621 Avenue Y Unit B
- 1710 Avenue X
- 1712 Avenue X
- 1611 Avenue Y
- 1623 Avenue Y
- 1706 Avenue X
- 1714 Avenue X
- 1612 Avenue Y Unit 302
- 1612 Avenue Y Unit 301