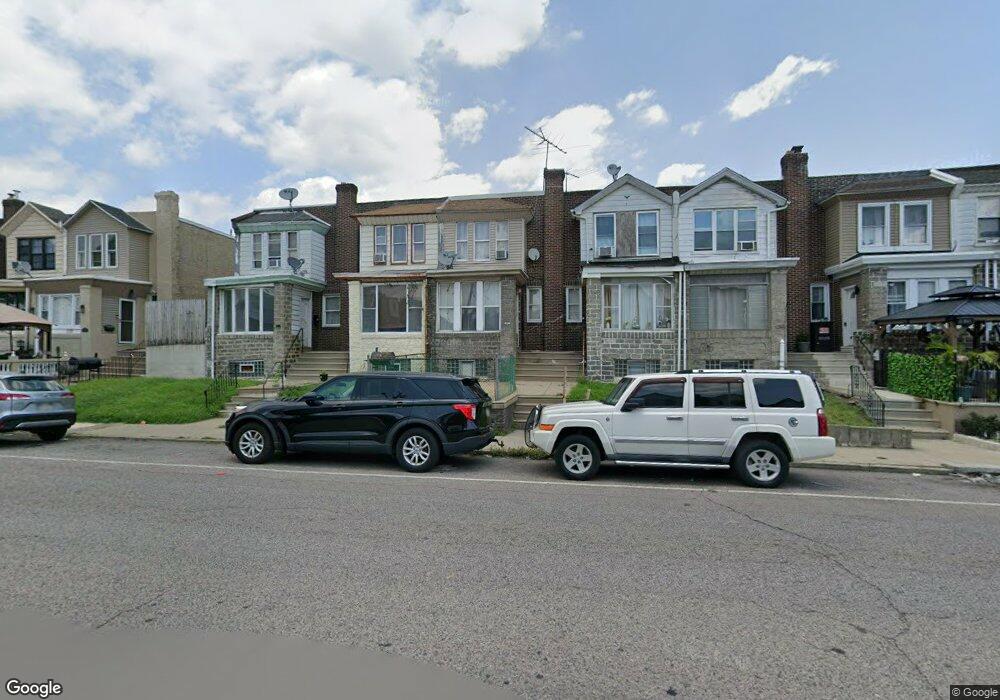
1617 E Hunting Park Ave Philadelphia, PA 19124
Juniata Park NeighborhoodEstimated Value: $161,000 - $207,000
3
Beds
1
Bath
1,050
Sq Ft
$170/Sq Ft
Est. Value
About This Home
This home is located at 1617 E Hunting Park Ave, Philadelphia, PA 19124 and is currently estimated at $178,013, approximately $169 per square foot. 1617 E Hunting Park Ave is a home located in Philadelphia County with nearby schools including Francis Hopkinson School, Frankford High School, and Mariana Bracetti Academy Cs.
Ownership History
Date
Name
Owned For
Owner Type
Purchase Details
Closed on
Feb 2, 2007
Sold by
Exume Jacqueline
Bought by
Torres Estrella
Current Estimated Value
Home Financials for this Owner
Home Financials are based on the most recent Mortgage that was taken out on this home.
Original Mortgage
$81,900
Outstanding Balance
$48,558
Interest Rate
6.16%
Mortgage Type
Purchase Money Mortgage
Estimated Equity
$129,455
Purchase Details
Closed on
May 10, 2005
Sold by
Gustave Exume Jacqueline and Exume Jacqueline
Bought by
Exume Jacqueline
Home Financials for this Owner
Home Financials are based on the most recent Mortgage that was taken out on this home.
Original Mortgage
$55,200
Interest Rate
8.17%
Mortgage Type
New Conventional
Purchase Details
Closed on
Mar 16, 1999
Sold by
Dillon Florence J and Yerkes Deborah
Bought by
Gustave Exume Jacqueline
Create a Home Valuation Report for This Property
The Home Valuation Report is an in-depth analysis detailing your home's value as well as a comparison with similar homes in the area
Home Values in the Area
Average Home Value in this Area
Purchase History
| Date | Buyer | Sale Price | Title Company |
|---|---|---|---|
| Torres Estrella | $81,900 | None Available | |
| Exume Jacqueline | -- | -- | |
| Gustave Exume Jacqueline | $39,900 | -- |
Source: Public Records
Mortgage History
| Date | Status | Borrower | Loan Amount |
|---|---|---|---|
| Open | Torres Estrella | $81,900 | |
| Previous Owner | Exume Jacqueline | $55,200 |
Source: Public Records
Tax History Compared to Growth
Tax History
| Year | Tax Paid | Tax Assessment Tax Assessment Total Assessment is a certain percentage of the fair market value that is determined by local assessors to be the total taxable value of land and additions on the property. | Land | Improvement |
|---|---|---|---|---|
| 2026 | $1,786 | $142,600 | $28,520 | $114,080 |
| 2025 | $1,786 | $142,600 | $28,520 | $114,080 |
| 2024 | $1,786 | $142,600 | $28,520 | $114,080 |
| 2023 | $1,786 | $127,600 | $25,520 | $102,080 |
| 2022 | $585 | $82,600 | $25,520 | $57,080 |
| 2021 | $1,215 | $0 | $0 | $0 |
| 2020 | $1,215 | $0 | $0 | $0 |
| 2019 | $1,128 | $0 | $0 | $0 |
| 2018 | $1,071 | $0 | $0 | $0 |
| 2017 | $1,071 | $0 | $0 | $0 |
| 2016 | $651 | $0 | $0 | $0 |
| 2015 | $623 | $0 | $0 | $0 |
| 2014 | -- | $76,500 | $13,900 | $62,600 |
| 2012 | -- | $10,304 | $1,581 | $8,723 |
Source: Public Records
Map
Nearby Homes
- 4222 O St
- 1554 E Lycoming St
- 1420-22 Deal St
- 1417 Deal St
- 1419 Deal St
- 4254 O St
- 1512 Adams Ave
- 4264 Neilson St
- 4218 Castor Ave
- 1501 Womrath St
- 4229 Griscom St
- 4042 Castor Ave
- 1519 Womrath St
- 4150 Maywood St
- 4229 Romain St
- 1400 E Bristol St
- 4252 M St
- 4247 Glendale St
- 1319 Church St
- 4321 Elizabeth St
- 1615 E Hunting Park Ave
- 1619 E Hunting Park Ave
- 1613 E Hunting Park Ave
- 1621 E Hunting Park Ave
- 1611 E Hunting Park Ave
- 1623 E Hunting Park Ave
- 1609 E Hunting Park Ave
- 1625 E Hunting Park Ave
- 1607 E Hunting Park Ave
- 1627 E Hunting Park Ave
- 1605 E Hunting Park Ave
- 1629 E Hunting Park Ave
- 1631 E Hunting Park Ave
- 1601 E Hunting Park Ave
- 1633 E Hunting Park Ave
- 1599 E Hunting Park Ave
- 1635 E Hunting Park Ave
- 1624 E Hunting Park Ave
- 1597 E Hunting Park Ave
- 1637 E Hunting Park Ave