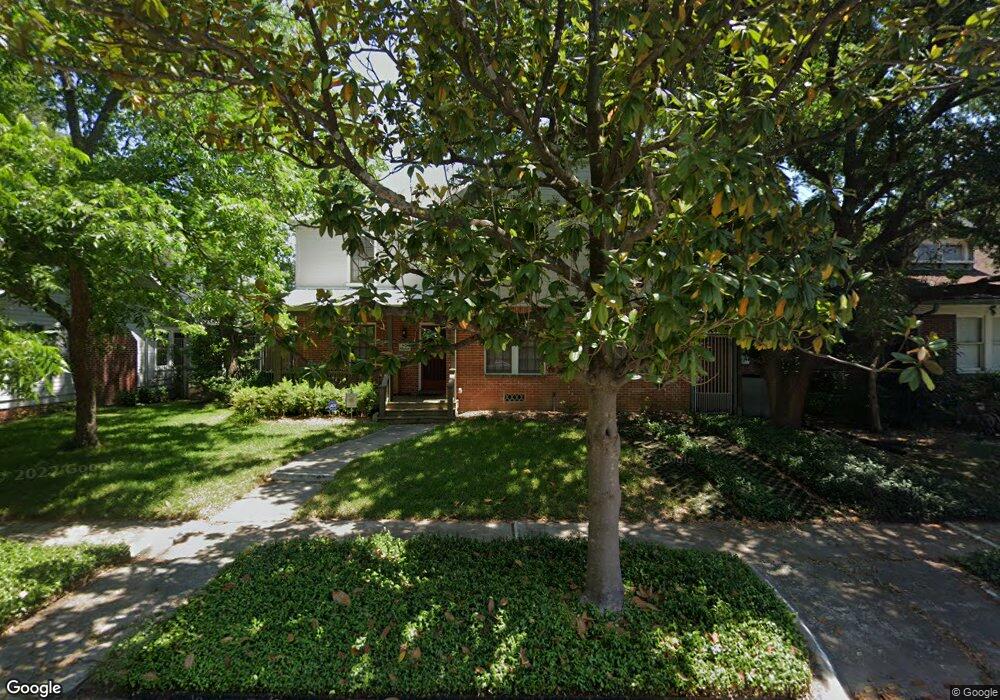
1617 Haver St Houston, TX 77006
Montrose NeighborhoodEstimated Value: $817,000 - $1,039,624
3
Beds
2
Baths
1,626
Sq Ft
$595/Sq Ft
Est. Value
About This Home
This home is located at 1617 Haver St, Houston, TX 77006 and is currently estimated at $967,406, approximately $594 per square foot. 1617 Haver St is a home located in Harris County with nearby schools including Baker Montessori, Lanier Middle School, and Lamar High School.
Ownership History
Date
Name
Owned For
Owner Type
Purchase Details
Closed on
Sep 11, 2000
Sold by
Austin James E and Austin Judy L
Bought by
Rensink Carol M and Rensink David G
Current Estimated Value
Home Financials for this Owner
Home Financials are based on the most recent Mortgage that was taken out on this home.
Original Mortgage
$150,000
Outstanding Balance
$57,642
Interest Rate
8.87%
Estimated Equity
$909,764
Purchase Details
Closed on
Sep 15, 1995
Sold by
Kennedy Sarah Louise and Kennedy Louise W
Bought by
Austin James E and Austin Judy L
Home Financials for this Owner
Home Financials are based on the most recent Mortgage that was taken out on this home.
Original Mortgage
$132,750
Interest Rate
7.76%
Purchase Details
Closed on
Sep 13, 1995
Sold by
Merrill J Michael
Bought by
Kennedy Sarah Louise
Home Financials for this Owner
Home Financials are based on the most recent Mortgage that was taken out on this home.
Original Mortgage
$132,750
Interest Rate
7.76%
Create a Home Valuation Report for This Property
The Home Valuation Report is an in-depth analysis detailing your home's value as well as a comparison with similar homes in the area
Home Values in the Area
Average Home Value in this Area
Purchase History
| Date | Buyer | Sale Price | Title Company |
|---|---|---|---|
| Rensink Carol M | -- | Houston Title | |
| Austin James E | -- | First American Title | |
| Kennedy Sarah Louise | -- | First American Title |
Source: Public Records
Mortgage History
| Date | Status | Borrower | Loan Amount |
|---|---|---|---|
| Open | Rensink Carol M | $150,000 | |
| Previous Owner | Austin James E | $132,750 |
Source: Public Records
Tax History Compared to Growth
Tax History
| Year | Tax Paid | Tax Assessment Tax Assessment Total Assessment is a certain percentage of the fair market value that is determined by local assessors to be the total taxable value of land and additions on the property. | Land | Improvement |
|---|---|---|---|---|
| 2025 | $9,182 | $1,042,522 | $569,800 | $472,722 |
| 2024 | $9,182 | $1,042,522 | $569,800 | $472,722 |
| 2023 | $9,182 | $1,048,837 | $569,800 | $479,037 |
| 2022 | $17,613 | $991,031 | $466,200 | $524,831 |
| 2021 | $16,719 | $717,351 | $466,200 | $251,151 |
| 2020 | $18,914 | $781,052 | $466,200 | $314,852 |
| 2019 | $20,771 | $820,860 | $458,100 | $362,760 |
| 2018 | $8,577 | $609,755 | $381,750 | $228,005 |
| 2017 | $15,088 | $568,602 | $381,750 | $186,852 |
| 2016 | $14,726 | $568,602 | $381,750 | $186,852 |
| 2015 | $7,420 | $504,503 | $330,850 | $173,653 |
| 2014 | $7,420 | $470,008 | $305,400 | $164,608 |
Source: Public Records
Map
Nearby Homes
- 1621 Haver St
- 1621 Cherryhurst St
- 1709 Haver St
- 1515 Hyde Park Blvd Unit 1
- 1621 California St
- 2516 Commonwealth St Unit 102
- 2506 Mandell St Unit 3
- 1705 Michigan St
- 2413 Ralph St Unit 2
- 1539 Westheimer Rd
- 2403 Commonwealth St
- 1728 Michigan St Unit A
- 1728 Michigan St Unit C
- 3311 Yupon St Unit 611
- 3311 Yupon St Unit 519
- 2410 Waugh Dr Unit 4C
- 2410 Waugh Dr Unit 3
- 1406 Fairview Ave
- 2100 Commonwealth St Unit E
- 2100 Commonwealth St Unit G
- 2505 Windsor St
- 1613 Haver St
- 2551 Windsor St
- 1618 Cherryhurst St
- 1607 Haver St
- 2555 Windsor St
- 1612 Cherryhurst St
- 1622 Cherryhurst St
- 1626 Cherryhurst St
- 1616 Haver St
- 1603 Haver St
- 1630 Cherryhurst St
- 1608 Cherryhurst St
- 1612 Haver St
- 1620 Haver St
- 2506 Windsor St
- 1701 Haver St
- 2506 Yupon St
- 2508 Yupon St
- 1601 Haver St