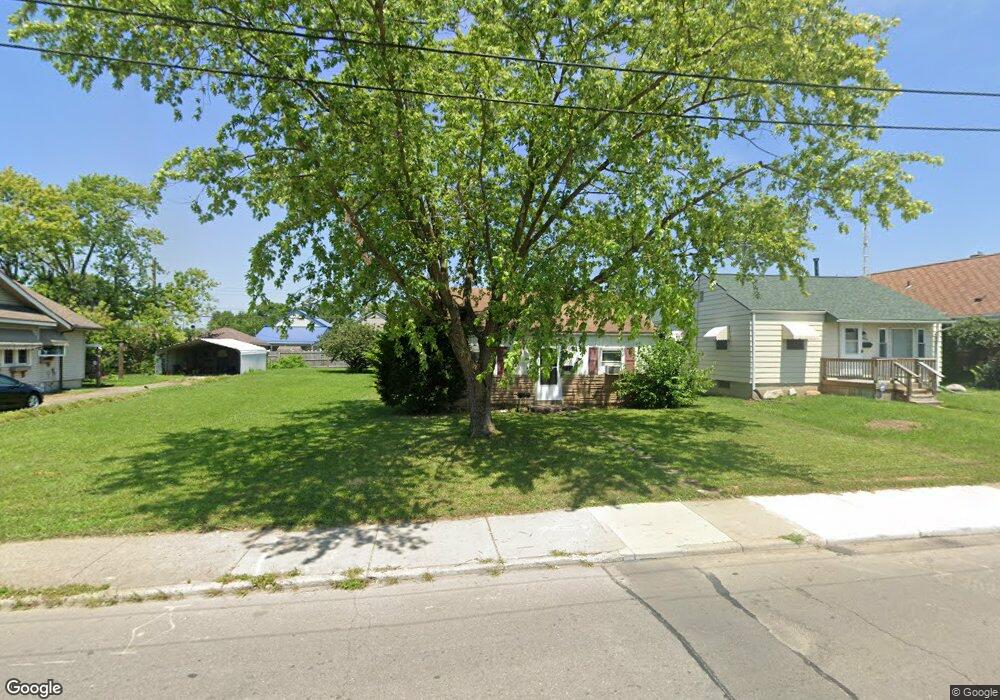
1617 Leo St Dayton, OH 45404
Old North Dayton NeighborhoodEstimated Value: $55,000 - $88,000
2
Beds
1
Bath
792
Sq Ft
$92/Sq Ft
Est. Value
About This Home
This home is located at 1617 Leo St, Dayton, OH 45404 and is currently estimated at $72,865, approximately $92 per square foot. 1617 Leo St is a home located in Montgomery County with nearby schools including Kiser Elementary, Ruskin Elementary School, and Pathway School of Discovery.
Ownership History
Date
Name
Owned For
Owner Type
Purchase Details
Closed on
Aug 10, 2015
Sold by
Maxcap Investment Holdings Llc
Bought by
Quest Ira Inc and Amy Geiger Ira #1794321
Current Estimated Value
Purchase Details
Closed on
Oct 16, 2014
Sold by
Federal Home Loan Mortgage Corporation
Bought by
Maxcap Investment Holdings Llc
Purchase Details
Closed on
Mar 17, 2014
Sold by
Fifth Third Mortgage Co
Bought by
Federal Home Loan Mortgage Corporation
Create a Home Valuation Report for This Property
The Home Valuation Report is an in-depth analysis detailing your home's value as well as a comparison with similar homes in the area
Home Values in the Area
Average Home Value in this Area
Purchase History
| Date | Buyer | Sale Price | Title Company |
|---|---|---|---|
| Quest Ira Inc | $35,000 | Landmark Title Agency South | |
| Maxcap Investment Holdings Llc | -- | Intitle Agency Inc | |
| Federal Home Loan Mortgage Corporation | $14,000 | None Available |
Source: Public Records
Tax History Compared to Growth
Tax History
| Year | Tax Paid | Tax Assessment Tax Assessment Total Assessment is a certain percentage of the fair market value that is determined by local assessors to be the total taxable value of land and additions on the property. | Land | Improvement |
|---|---|---|---|---|
| 2024 | $617 | $10,110 | $2,970 | $7,140 |
| 2023 | $617 | $10,110 | $2,970 | $7,140 |
| 2022 | $676 | $8,620 | $2,540 | $6,080 |
| 2021 | $673 | $8,620 | $2,540 | $6,080 |
| 2020 | $671 | $8,620 | $2,540 | $6,080 |
| 2019 | $521 | $5,820 | $2,140 | $3,680 |
| 2018 | $521 | $5,820 | $2,140 | $3,680 |
| 2017 | $518 | $5,820 | $2,140 | $3,680 |
| 2016 | $512 | $5,460 | $2,030 | $3,430 |
| 2015 | $486 | $5,460 | $2,030 | $3,430 |
| 2014 | $486 | $5,460 | $2,030 | $3,430 |
| 2012 | -- | $11,040 | $4,580 | $6,460 |
Source: Public Records
Map
Nearby Homes