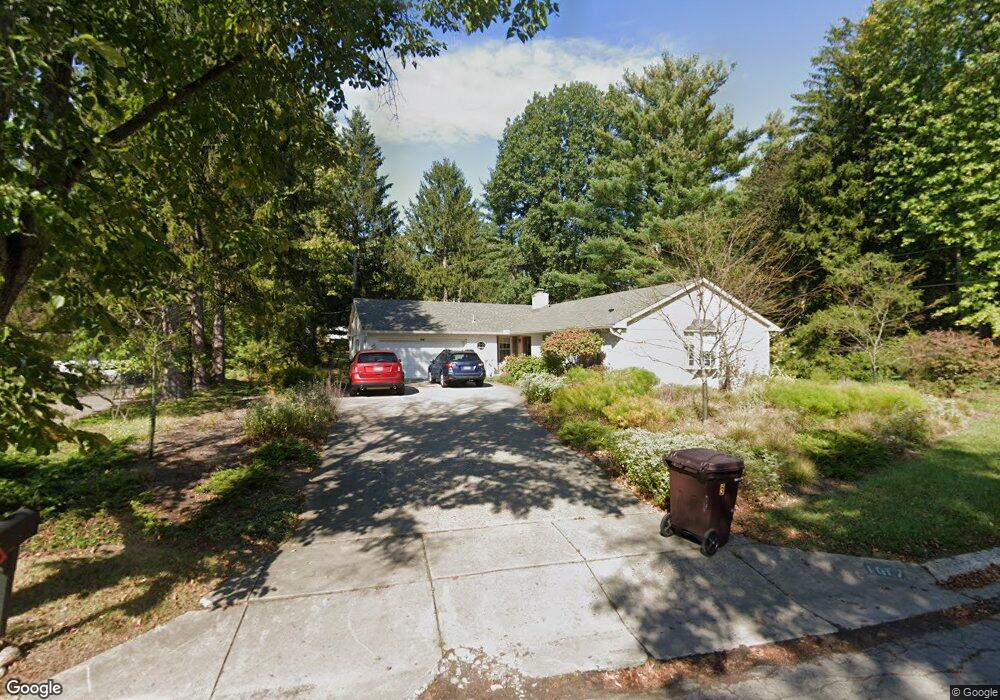
1617 Mercer Ct Yellow Springs, OH 45387
Estimated Value: $406,426 - $489,000
3
Beds
3
Baths
1,550
Sq Ft
$283/Sq Ft
Est. Value
About This Home
This home is located at 1617 Mercer Ct, Yellow Springs, OH 45387 and is currently estimated at $439,107, approximately $283 per square foot. 1617 Mercer Ct is a home located in Greene County with nearby schools including Mills Lawn Elementary School, Yellow Springs High School & McKinney Middle School, and The Antioch School.
Ownership History
Date
Name
Owned For
Owner Type
Purchase Details
Closed on
Jul 28, 2020
Sold by
Crandall Joel L and Crandall Beth W
Bought by
Crandall Joel L and Crandall Beth W
Current Estimated Value
Purchase Details
Closed on
Jun 15, 2006
Sold by
Gonzalez Maria and Slattery William A
Bought by
Crandall Joel L and Crandall Beth W
Home Financials for this Owner
Home Financials are based on the most recent Mortgage that was taken out on this home.
Original Mortgage
$150,000
Interest Rate
6.88%
Mortgage Type
Unknown
Purchase Details
Closed on
Apr 17, 2000
Sold by
Gonzalez Maria
Bought by
Gonzalez Maria and Gonzalez William A
Purchase Details
Closed on
Sep 24, 1999
Sold by
Sonnycalb Kevin R
Bought by
Gonzalez Maria
Home Financials for this Owner
Home Financials are based on the most recent Mortgage that was taken out on this home.
Original Mortgage
$132,000
Interest Rate
7.12%
Create a Home Valuation Report for This Property
The Home Valuation Report is an in-depth analysis detailing your home's value as well as a comparison with similar homes in the area
Home Values in the Area
Average Home Value in this Area
Purchase History
| Date | Buyer | Sale Price | Title Company |
|---|---|---|---|
| Crandall Joel L | -- | None Available | |
| Crandall Joel L | $259,900 | Vantage Land Title Inc | |
| Gonzalez Maria | -- | -- | |
| Gonzalez Maria | $165,000 | -- |
Source: Public Records
Mortgage History
| Date | Status | Borrower | Loan Amount |
|---|---|---|---|
| Previous Owner | Crandall Joel L | $150,000 | |
| Previous Owner | Gonzalez Maria | $132,000 |
Source: Public Records
Tax History Compared to Growth
Tax History
| Year | Tax Paid | Tax Assessment Tax Assessment Total Assessment is a certain percentage of the fair market value that is determined by local assessors to be the total taxable value of land and additions on the property. | Land | Improvement |
|---|---|---|---|---|
| 2024 | $6,479 | $116,440 | $25,860 | $90,580 |
| 2023 | $6,479 | $116,440 | $25,860 | $90,580 |
| 2022 | $5,579 | $95,110 | $25,860 | $69,250 |
| 2021 | $5,366 | $95,110 | $25,860 | $69,250 |
| 2020 | $5,384 | $95,110 | $25,860 | $69,250 |
| 2019 | $4,729 | $76,020 | $14,780 | $61,240 |
| 2018 | $4,715 | $76,020 | $14,780 | $61,240 |
| 2017 | $4,655 | $76,020 | $14,780 | $61,240 |
| 2016 | $4,164 | $68,110 | $14,780 | $53,330 |
| 2015 | $4,232 | $68,110 | $14,780 | $53,330 |
| 2014 | $4,083 | $68,110 | $14,780 | $53,330 |
Source: Public Records
Map
Nearby Homes
- 1360 Meadow Ln
- 1645 Randall Rd
- 420 Spring Glen Dr
- 1302 Shawnee Dr
- 117 Allen St
- 310 Allen St
- 1315 Corry St
- 00 Xenia Ave
- 517 Iris Dr
- 510 Iris Dr
- 117 E North College St
- 750 W South College St
- 504 Phillips St
- 675 Wright St
- 425 Suncrest Dr Unit 1 & 2
- 414 S High St
- 345 E Enon Rd
- 125 Park Meadows Dr
- 137 Kenneth Hamilton Way
- 134 Kenneth Hamilton Way
- 1615 Mercer Ct
- 1620 Mercer Ct
- 1613 Mercer Ct
- 1441 Meadow Ln
- 1612 Mercer Ct
- 1435 Meadow Ln
- 1616 Mercer Ct
- F19-1-6-4800 Mercer Ct
- 1609 Mercer Ct
- 1431 Meadow Ln
- 1445 Meadow Ln
- 14 Helen Ct
- 1605 Spillan Rd
- 1615 Spillan Rd
- 1605 Mercer Ct
- 1600 Mercer Ct
- 300 Orton Rd
- 1625 Spillan Rd
- 10 Helen Ct
- 1455 Meadow Ln