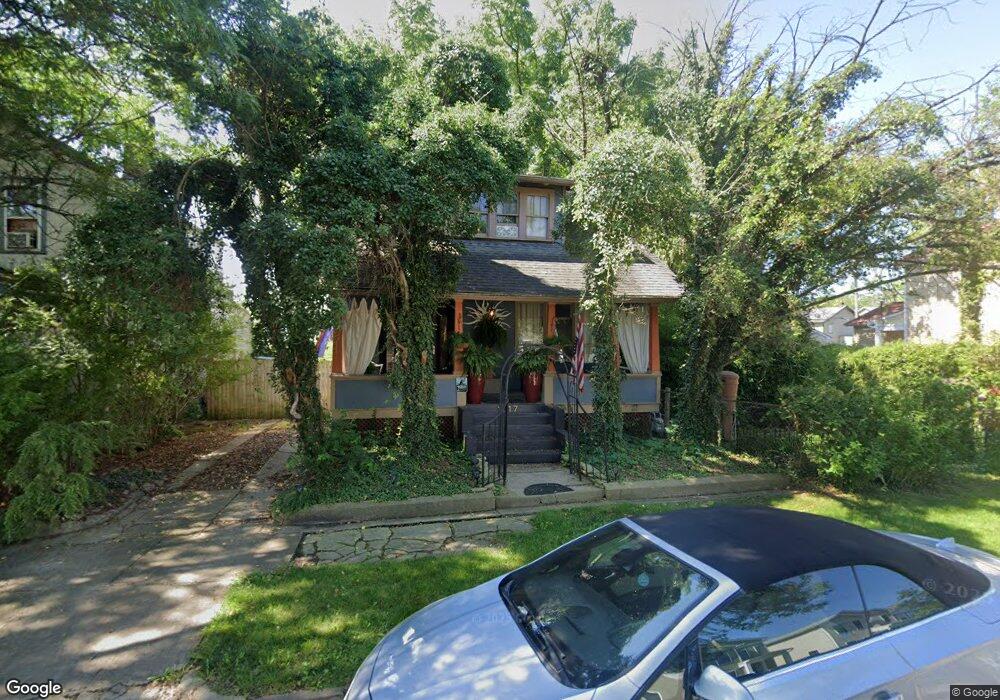
1617 Myrtle Ave Columbus, OH 43211
North Linden NeighborhoodEstimated Value: $112,000 - $174,918
2
Beds
1
Bath
1,308
Sq Ft
$112/Sq Ft
Est. Value
About This Home
This home is located at 1617 Myrtle Ave, Columbus, OH 43211 and is currently estimated at $146,480, approximately $111 per square foot. 1617 Myrtle Ave is a home located in Franklin County with nearby schools including Linden STEM Academy (K-6), Linden-Mckinley Stem School On Arcadia, and Focus Learning Academy of Central Columbus.
Ownership History
Date
Name
Owned For
Owner Type
Purchase Details
Closed on
Aug 22, 2000
Sold by
Vocca Rebecca and Estate Of Robert Vocca
Bought by
Lathram John S
Current Estimated Value
Home Financials for this Owner
Home Financials are based on the most recent Mortgage that was taken out on this home.
Original Mortgage
$56,000
Outstanding Balance
$22,112
Interest Rate
10.37%
Estimated Equity
$124,368
Purchase Details
Closed on
May 22, 1997
Sold by
Kortenbach Mary M and Mille Mary
Bought by
Vocca Robert and Lathram John S
Home Financials for this Owner
Home Financials are based on the most recent Mortgage that was taken out on this home.
Original Mortgage
$39,366
Interest Rate
8.24%
Mortgage Type
FHA
Purchase Details
Closed on
May 20, 1997
Sold by
Miller Kortenbach Mary M and Miller Mary
Bought by
Vocca Robert and Lathram John S
Home Financials for this Owner
Home Financials are based on the most recent Mortgage that was taken out on this home.
Original Mortgage
$39,366
Interest Rate
8.24%
Mortgage Type
FHA
Purchase Details
Closed on
Dec 9, 1987
Purchase Details
Closed on
Sep 1, 1985
Create a Home Valuation Report for This Property
The Home Valuation Report is an in-depth analysis detailing your home's value as well as a comparison with similar homes in the area
Home Values in the Area
Average Home Value in this Area
Purchase History
| Date | Buyer | Sale Price | Title Company |
|---|---|---|---|
| Lathram John S | $8,500 | -- | |
| Vocca Robert | $4,500 | Franklin Abstract | |
| Vocca Robert | $39,000 | Franklin Abstract | |
| -- | -- | -- | |
| -- | $27,900 | -- |
Source: Public Records
Mortgage History
| Date | Status | Borrower | Loan Amount |
|---|---|---|---|
| Open | Lathram John S | $56,000 | |
| Previous Owner | Vocca Robert | $39,366 |
Source: Public Records
Tax History
| Year | Tax Paid | Tax Assessment Tax Assessment Total Assessment is a certain percentage of the fair market value that is determined by local assessors to be the total taxable value of land and additions on the property. | Land | Improvement |
|---|---|---|---|---|
| 2025 | $2,080 | $57,540 | $12,180 | $45,360 |
| 2024 | $2,080 | $57,540 | $12,180 | $45,360 |
| 2023 | $2,047 | $57,540 | $12,180 | $45,360 |
| 2022 | $937 | $27,760 | $10,430 | $17,330 |
| 2021 | $939 | $27,760 | $10,430 | $17,330 |
| 2020 | $1,042 | $27,760 | $10,430 | $17,330 |
| 2019 | $850 | $22,760 | $9,070 | $13,690 |
| 2018 | $697 | $21,320 | $7,630 | $13,690 |
| 2017 | $730 | $21,320 | $7,630 | $13,690 |
| 2016 | $698 | $19,290 | $5,320 | $13,970 |
| 2015 | $634 | $19,290 | $5,320 | $13,970 |
| 2014 | $635 | $19,290 | $5,320 | $13,970 |
| 2013 | $414 | $22,680 | $6,265 | $16,415 |
Source: Public Records
Map
Nearby Homes
- 1544 Briarwood Ave
- 1545 Arlington Ave
- 2305 Cleveland Ave
- 1509 Loretta Ave
- 1450 Briarwood Ave
- 1799 Harold Place
- 0 Aberdeen Ave Unit 226000728
- 0 Aberdeen Ave Unit 226002456
- 0 Aberdeen Ave Unit 226002459
- 0 Aberdeen Ave Unit 226002457
- 0 Aberdeen Ave Unit 226002458
- 1525 Aberdeen Ave
- 1326 Minnesota Ave
- 1481 Kohr Place
- 1411 Genessee Ave
- 1608 Kenmore Rd
- 1435 Kohr Place
- 1827 Aberdeen Ave
- 1625 Kenmore Rd
- 1430 Kenmore Rd
- 1607 Myrtle Ave
- 1621 Myrtle Ave
- 1603 Myrtle Ave
- 1629 Myrtle Ave
- 1606 Briarwood Ave
- 1612 Briarwood Ave
- 1602 Briarwood Ave
- 1618 Briarwood Ave
- 1631 Myrtle Ave
- 1598 Briarwood Ave
- 1622 Briarwood Ave
- 1618 Myrtle Ave
- 1614 Myrtle Ave
- 1610 Myrtle Ave
- 1624 Briarwood Ave
- 1624 Myrtle Ave
- 1604 Myrtle Ave
- 1591 Myrtle Ave
- 1628 Myrtle Ave
- 1637 Myrtle Ave
Your Personal Tour Guide
Ask me questions while you tour the home.