Estimated Value: $688,000 - $733,000
--
Bed
--
Bath
2,152
Sq Ft
$331/Sq Ft
Est. Value
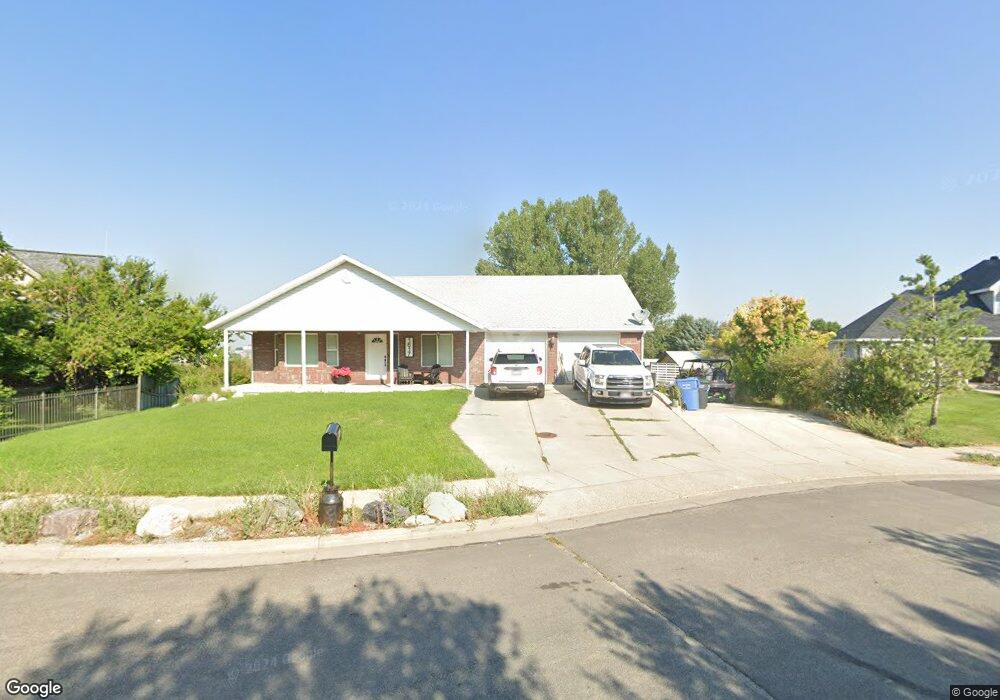
About This Home
This home is located at 1617 N 1100 E, Logan, UT 84341 and is currently estimated at $712,205, approximately $330 per square foot. 1617 N 1100 E is a home with nearby schools including Greenville School, Cedar Ridge School, and Cedar Ridge Middle School.
Ownership History
Date
Name
Owned For
Owner Type
Purchase Details
Closed on
Aug 19, 2022
Sold by
Henrie Daron C and Henrie Verlyne B
Bought by
Henrie Nathaniel Craig and Henrie Kaylee
Current Estimated Value
Home Financials for this Owner
Home Financials are based on the most recent Mortgage that was taken out on this home.
Original Mortgage
$300,000
Outstanding Balance
$286,427
Interest Rate
5.51%
Mortgage Type
New Conventional
Estimated Equity
$425,778
Purchase Details
Closed on
Feb 5, 2002
Sold by
Henrie Weston G and Henrie Norma H
Bought by
Henrie Daron C and Henrie Verlyne
Create a Home Valuation Report for This Property
The Home Valuation Report is an in-depth analysis detailing your home's value as well as a comparison with similar homes in the area
Home Values in the Area
Average Home Value in this Area
Purchase History
| Date | Buyer | Sale Price | Title Company |
|---|---|---|---|
| Henrie Nathaniel Craig | -- | None Listed On Document | |
| Henrie Daron C | -- | Cache Title Company | |
| Henrie Weston G | -- | Cache Title Company |
Source: Public Records
Mortgage History
| Date | Status | Borrower | Loan Amount |
|---|---|---|---|
| Open | Henrie Nathaniel Craig | $300,000 |
Source: Public Records
Tax History Compared to Growth
Tax History
| Year | Tax Paid | Tax Assessment Tax Assessment Total Assessment is a certain percentage of the fair market value that is determined by local assessors to be the total taxable value of land and additions on the property. | Land | Improvement |
|---|---|---|---|---|
| 2025 | $2,763 | $386,805 | $0 | $0 |
| 2024 | $2,920 | $380,360 | $0 | $0 |
| 2023 | $2,799 | $341,200 | $0 | $0 |
| 2022 | $2,930 | $341,200 | $0 | $0 |
| 2021 | $2,843 | $513,295 | $85,000 | $428,295 |
| 2020 | $2,490 | $421,617 | $85,000 | $336,617 |
| 2019 | $2,608 | $421,616 | $85,000 | $336,616 |
| 2018 | $2,230 | $349,710 | $57,000 | $292,710 |
| 2017 | $2,153 | $177,705 | $0 | $0 |
| 2016 | $2,187 | $177,705 | $0 | $0 |
| 2015 | $2,132 | $172,580 | $0 | $0 |
| 2014 | $2,081 | $172,580 | $0 | $0 |
| 2013 | -- | $172,120 | $0 | $0 |
Source: Public Records
Map
Nearby Homes
- 1285 E 1600 N
- Sydney Plan at Mountainside Estates
- Providence Plan at Mountainside Estates
- Maryland Plan at Mountainside Estates
- Rochester Plan at Mountainside Estates
- Oakley Plan at Mountainside Estates
- Harmony Plan at Mountainside Estates
- 1395 E Talmage Ln Unit 31
- 1374 N 1250 E
- 1963 N 1000 E
- 1901 N 1380 E
- 1454 N 1400 E
- 1357 E 1220 N
- Cedar Ridge Plan at Foothill Lofts
- Viewside Plan at Foothill Lofts
- Crimson Plan at Foothill Lofts
- Chamberlain Plan at Foothill Lofts
- Lincoln Plan at Foothill Lofts
- Hamilton Plan at Foothill Lofts
- Fairway Plan at Foothill Lofts