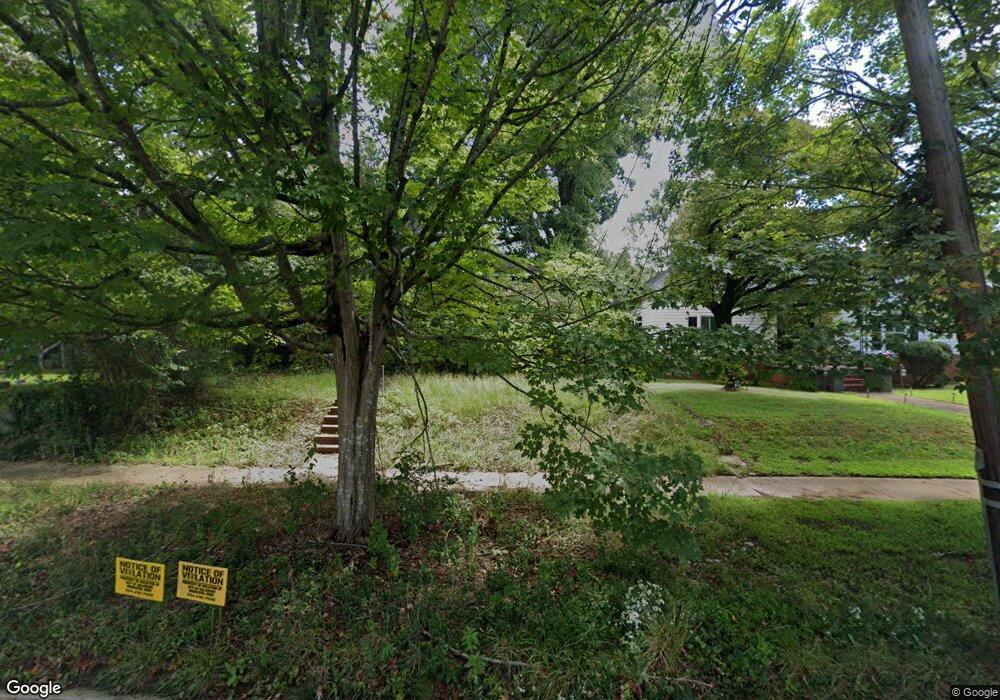
1617 N Main St Salisbury, NC 28144
Estimated Value: $145,000 - $207,000
3
Beds
2
Baths
1,370
Sq Ft
$127/Sq Ft
Est. Value
About This Home
This home is located at 1617 N Main St, Salisbury, NC 28144 and is currently estimated at $174,164, approximately $127 per square foot. 1617 N Main St is a home located in Rowan County with nearby schools including Carroll T Overton Elementary School, North Rowan Middle School, and Salisbury High School.
Ownership History
Date
Name
Owned For
Owner Type
Purchase Details
Closed on
Feb 19, 2009
Sold by
Deutsche Bank National Trust Company
Bought by
Valia Sachin
Current Estimated Value
Purchase Details
Closed on
May 2, 2008
Sold by
Brown Jimmy R
Bought by
Deutsche Bank National Trust Co and Novastar Mortgage Funding Trust Series 2
Purchase Details
Closed on
Nov 22, 2006
Sold by
Lomax William L and Lomax Barbara
Bought by
Brown Jimmy R
Home Financials for this Owner
Home Financials are based on the most recent Mortgage that was taken out on this home.
Original Mortgage
$75,300
Interest Rate
10.8%
Mortgage Type
Unknown
Purchase Details
Closed on
Mar 19, 2004
Sold by
Feeney Linda K Saunders and Feeney Brendan
Bought by
Lomax William L and Lomax Barbara
Create a Home Valuation Report for This Property
The Home Valuation Report is an in-depth analysis detailing your home's value as well as a comparison with similar homes in the area
Home Values in the Area
Average Home Value in this Area
Purchase History
| Date | Buyer | Sale Price | Title Company |
|---|---|---|---|
| Valia Sachin | $18,000 | None Available | |
| Deutsche Bank National Trust Co | $58,650 | None Available | |
| Brown Jimmy R | $85,000 | None Available | |
| Lomax William L | $47,500 | -- |
Source: Public Records
Mortgage History
| Date | Status | Borrower | Loan Amount |
|---|---|---|---|
| Previous Owner | Brown Jimmy R | $75,300 |
Source: Public Records
Tax History
| Year | Tax Paid | Tax Assessment Tax Assessment Total Assessment is a certain percentage of the fair market value that is determined by local assessors to be the total taxable value of land and additions on the property. | Land | Improvement |
|---|---|---|---|---|
| 2025 | $680 | $56,823 | $17,713 | $39,110 |
| 2024 | $680 | $56,823 | $17,713 | $39,110 |
| 2023 | $680 | $56,823 | $17,713 | $39,110 |
| 2022 | $520 | $37,731 | $13,625 | $24,106 |
| 2021 | $520 | $37,731 | $13,625 | $24,106 |
| 2020 | $520 | $37,731 | $13,625 | $24,106 |
| 2019 | $520 | $37,731 | $13,625 | $24,106 |
| 2018 | $864 | $63,624 | $13,625 | $49,999 |
| 2017 | $860 | $63,624 | $13,625 | $49,999 |
| 2016 | $836 | $63,624 | $13,625 | $49,999 |
| 2015 | $841 | $63,624 | $13,625 | $49,999 |
| 2014 | $849 | $64,945 | $12,807 | $52,138 |
Source: Public Records
Map
Nearby Homes
- 107 W 17th St
- 0 S Yadkin Ave Unit CAR4338761
- 1460 N Jackson St
- 929 S Long St
- 321 W 14th St
- 1329 Maxwell St
- 1009 Hunt Ln
- 223 Robin Cir
- 1280 N Shaver St
- 1201 N Church St
- 1270 N Shaver St
- 127 E 11th St
- 1214 Short St
- 1200 Grady St
- 1121 Richard St
- 1129 Grady St
- 1212 S Salisbury Ave
- 000 N Jackson St
- 1138 Laurel St
- 1008 N Main St
Your Personal Tour Guide
Ask me questions while you tour the home.