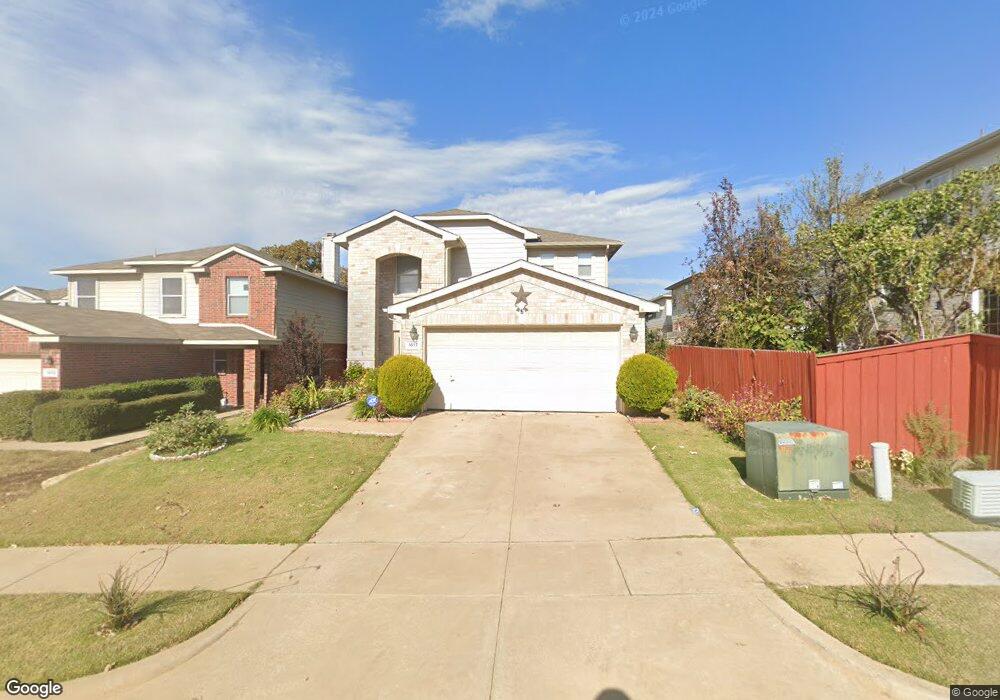
1617 Timber Glen Dr Bedford, TX 76022
Estimated Value: $411,777 - $466,000
4
Beds
3
Baths
2,590
Sq Ft
$171/Sq Ft
Est. Value
About This Home
This home is located at 1617 Timber Glen Dr, Bedford, TX 76022 and is currently estimated at $443,694, approximately $171 per square foot. 1617 Timber Glen Dr is a home located in Tarrant County with nearby schools including Bell Manor Elementary School, Central J High School, and Trinity High School.
Ownership History
Date
Name
Owned For
Owner Type
Purchase Details
Closed on
Oct 25, 2017
Sold by
Saleemi Khalida Rashid and Iqbal Ahmed
Bought by
Limbu Tar B and Limbu Chandra K
Current Estimated Value
Home Financials for this Owner
Home Financials are based on the most recent Mortgage that was taken out on this home.
Original Mortgage
$232,650
Outstanding Balance
$194,588
Interest Rate
3.78%
Mortgage Type
New Conventional
Estimated Equity
$249,106
Purchase Details
Closed on
Aug 28, 2007
Sold by
Rodriguez Jose M and Rodriguez Juanita C
Bought by
Saleemi Khalida Rashid and Iqbal Ahmad
Home Financials for this Owner
Home Financials are based on the most recent Mortgage that was taken out on this home.
Original Mortgage
$171,000
Interest Rate
6.72%
Mortgage Type
Purchase Money Mortgage
Purchase Details
Closed on
Sep 20, 1995
Sold by
Reed John Worley
Bought by
Reed Ursula Kate
Create a Home Valuation Report for This Property
The Home Valuation Report is an in-depth analysis detailing your home's value as well as a comparison with similar homes in the area
Home Values in the Area
Average Home Value in this Area
Purchase History
| Date | Buyer | Sale Price | Title Company |
|---|---|---|---|
| Limbu Tar B | -- | None Available | |
| Saleemi Khalida Rashid | -- | None Available | |
| Reed Ursula Kate | -- | -- |
Source: Public Records
Mortgage History
| Date | Status | Borrower | Loan Amount |
|---|---|---|---|
| Open | Limbu Tar B | $232,650 | |
| Previous Owner | Saleemi Khalida Rashid | $171,000 |
Source: Public Records
Tax History Compared to Growth
Tax History
| Year | Tax Paid | Tax Assessment Tax Assessment Total Assessment is a certain percentage of the fair market value that is determined by local assessors to be the total taxable value of land and additions on the property. | Land | Improvement |
|---|---|---|---|---|
| 2025 | $5,530 | $387,103 | $70,000 | $317,103 |
| 2024 | $5,530 | $407,477 | $70,000 | $337,477 |
| 2023 | $6,101 | $388,000 | $35,000 | $353,000 |
| 2022 | $6,316 | $338,186 | $35,000 | $303,186 |
| 2021 | $6,192 | $262,882 | $35,000 | $227,882 |
| 2020 | $6,250 | $262,882 | $35,000 | $227,882 |
| 2019 | $6,633 | $276,464 | $35,000 | $241,464 |
| 2018 | $5,649 | $248,232 | $28,000 | $220,232 |
| 2017 | $5,531 | $228,639 | $28,000 | $200,639 |
| 2016 | $5,425 | $224,239 | $28,000 | $196,239 |
| 2015 | $4,857 | $193,400 | $28,000 | $165,400 |
| 2014 | $4,857 | $193,400 | $28,000 | $165,400 |
Source: Public Records
Map
Nearby Homes
- 1509 Shirley Way
- 1701 Winchester Way
- 2025 Schumac Ln
- 1213 Briar Dr
- 1204 Edgecliff Dr
- 2201 Greendale Ct
- 1004 Overhill Dr
- 1031 Boston Blvd
- 933 Charleston Ct
- 1213 Greendale Dr
- 1613 Trinity Ct
- 6 Park Ln
- 18 Park Ln
- 921 Overhill Dr
- 952 Charleston Dr
- 2024 Charleston Dr
- 2421 Creek Villas Dr
- 909 Overhill Dr
- 2101 Gettysburg Place
- 31 Morrow Dr
- 1613 Timber Glen Dr
- 1705 Willow Way
- 1609 Timber Glen Dr
- 1709 Willow Way
- 1701 Willow Way
- 1713 Willow Way
- 1605 Timber Glen Dr
- 1717 Willow Way
- 1620R Timber Glen Dr
- 1601 Timber Glen Dr
- 1620 Timber Glen Dr
- 1721 Willow Way
- 1624 Timber Glen Dr
- 1616 Timber Glen Dr
- 1628 Timber Glen Dr
- 1632R Timber Glen Dr
- 1612 Timber Glen Dr
- 1632 Timber Glen Dr
- 1725 Willow Way
- 1608 Timber Glen Dr