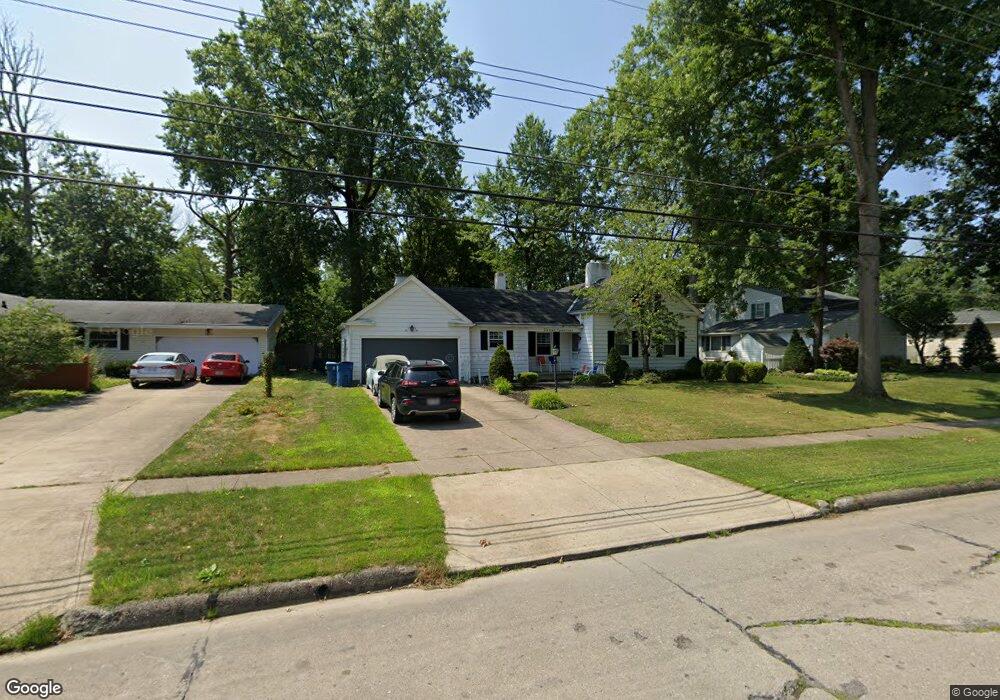
1617 W 44th St Lorain, OH 44053
Estimated Value: $159,000 - $205,000
3
Beds
2
Baths
1,297
Sq Ft
$147/Sq Ft
Est. Value
About This Home
This home is located at 1617 W 44th St, Lorain, OH 44053 and is currently estimated at $190,256, approximately $146 per square foot. 1617 W 44th St is a home located in Lorain County with nearby schools including Toni Wofford Morrison Elementary School, Gen. Johnnie Wilson Middle School, and Lorain High School.
Ownership History
Date
Name
Owned For
Owner Type
Purchase Details
Closed on
Oct 1, 2021
Sold by
Kelley Daniel J
Bought by
Evans Heather
Current Estimated Value
Home Financials for this Owner
Home Financials are based on the most recent Mortgage that was taken out on this home.
Original Mortgage
$96,662
Outstanding Balance
$88,147
Interest Rate
2.8%
Mortgage Type
FHA
Estimated Equity
$102,109
Purchase Details
Closed on
Sep 11, 2017
Sold by
Parsons Jacqueline C
Bought by
Kelley Daniel J
Home Financials for this Owner
Home Financials are based on the most recent Mortgage that was taken out on this home.
Original Mortgage
$61,600
Interest Rate
3.92%
Mortgage Type
New Conventional
Purchase Details
Closed on
Jul 21, 2016
Sold by
Parsons Charles Alan and Parsons Jacqueline Anne
Bought by
Parsons Jacqueline Anne
Create a Home Valuation Report for This Property
The Home Valuation Report is an in-depth analysis detailing your home's value as well as a comparison with similar homes in the area
Home Values in the Area
Average Home Value in this Area
Purchase History
| Date | Buyer | Sale Price | Title Company |
|---|---|---|---|
| Evans Heather | $115,000 | American Patriot Title | |
| Kelley Daniel J | $77,000 | American Patriot Title | |
| Parsons Jacqueline Anne | -- | -- |
Source: Public Records
Mortgage History
| Date | Status | Borrower | Loan Amount |
|---|---|---|---|
| Open | Evans Heather | $96,662 | |
| Previous Owner | Kelley Daniel J | $61,600 |
Source: Public Records
Tax History Compared to Growth
Tax History
| Year | Tax Paid | Tax Assessment Tax Assessment Total Assessment is a certain percentage of the fair market value that is determined by local assessors to be the total taxable value of land and additions on the property. | Land | Improvement |
|---|---|---|---|---|
| 2024 | $2,454 | $58,090 | $10,140 | $47,950 |
| 2023 | $2,284 | $43,239 | $12,243 | $30,996 |
| 2022 | $2,265 | $43,239 | $12,243 | $30,996 |
| 2021 | $2,265 | $43,239 | $12,243 | $30,996 |
| 2020 | $2,219 | $36,800 | $10,420 | $26,380 |
| 2019 | $2,207 | $36,800 | $10,420 | $26,380 |
| 2018 | $2,083 | $36,800 | $10,420 | $26,380 |
| 2017 | $1,958 | $31,580 | $10,300 | $21,280 |
| 2016 | $1,404 | $31,580 | $10,300 | $21,280 |
| 2015 | $1,325 | $31,580 | $10,300 | $21,280 |
| 2014 | $1,589 | $36,210 | $11,810 | $24,400 |
| 2013 | $1,577 | $36,210 | $11,810 | $24,400 |
Source: Public Records
Map
Nearby Homes
- 4323 Marshall Ave
- 4610 Ashland Ave
- 5204 7 Pines Dr
- 5208 7 Pines Dr
- 1234 W 39th St
- 1106 W 42nd Place
- 4977-4985 Oberlin Ave
- 2501 W 40th St
- 1216 W 35th St
- 2600 W 40th St
- 4002 Washington Ave
- 4036 Kenyon Ave
- 4872 Leavitt Rd
- 1931 Mark Dr
- 2315 Mark Dr
- 45055 N Ridge Rd
- 2782 Oberlin Ave
- 2780 Oberlin Ave
- 1240 W 27th Place
- 5915 Clement Dr
- 1611 W 44th St
- 1623 W 44th St
- 1604 Redbud Place
- 1603 W 44th St
- 4403 Edgewood Dr
- 4415 Edgewood Dr
- 1608 Redbud Place
- 1618 W 44th St
- 1610 W 44th St
- 1624 W 44th St
- 4419 Edgewood Dr
- 1527 W 44th St
- 1600 W 44th St
- 1522 Redbud Place
- 4423 Edgewood Dr
- 4315 Edgewood Dr
- 4416 Edgewood Dr
- 1609 Redbud Place
- 1519 W 44th St
- 1617 W 43rd St