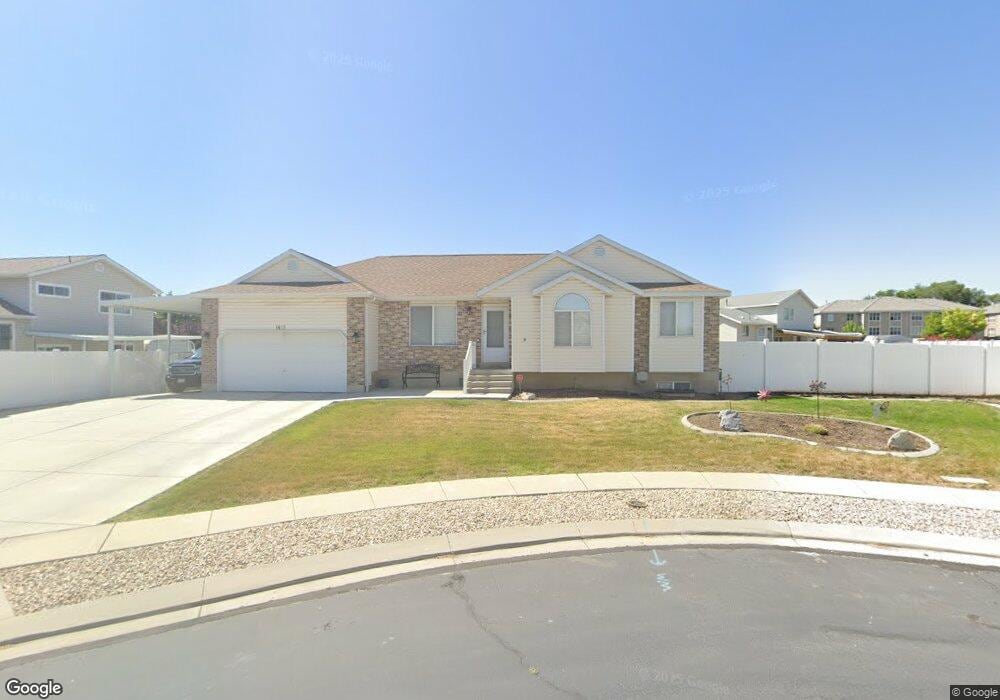
1617 W 8470 S West Jordan, UT 84088
Estimated Value: $552,262 - $702,000
3
Beds
2
Baths
1,559
Sq Ft
$397/Sq Ft
Est. Value
About This Home
This home is located at 1617 W 8470 S, West Jordan, UT 84088 and is currently estimated at $619,316, approximately $397 per square foot. 1617 W 8470 S is a home located in Salt Lake County with nearby schools including Riverside Elementary School, West Jordan Middle School, and West Jordan High School.
Ownership History
Date
Name
Owned For
Owner Type
Purchase Details
Closed on
Sep 30, 2019
Sold by
Johnson Dennis R and Johnson Susan M
Bought by
Johnson Dennis and Johnson Susan M
Current Estimated Value
Home Financials for this Owner
Home Financials are based on the most recent Mortgage that was taken out on this home.
Original Mortgage
$264,000
Outstanding Balance
$231,277
Interest Rate
3.5%
Mortgage Type
New Conventional
Estimated Equity
$388,039
Purchase Details
Closed on
Nov 18, 1996
Sold by
Trade West Development Corp
Bought by
Johnson Dennis R and Johnson Susan M
Home Financials for this Owner
Home Financials are based on the most recent Mortgage that was taken out on this home.
Original Mortgage
$138,044
Interest Rate
8.5%
Mortgage Type
VA
Create a Home Valuation Report for This Property
The Home Valuation Report is an in-depth analysis detailing your home's value as well as a comparison with similar homes in the area
Home Values in the Area
Average Home Value in this Area
Purchase History
| Date | Buyer | Sale Price | Title Company |
|---|---|---|---|
| Johnson Dennis | -- | Old Republic Ttl Draper Orem | |
| Johnson Dennis R | -- | -- |
Source: Public Records
Mortgage History
| Date | Status | Borrower | Loan Amount |
|---|---|---|---|
| Open | Johnson Dennis | $264,000 | |
| Closed | Johnson Dennis R | $138,044 |
Source: Public Records
Tax History Compared to Growth
Tax History
| Year | Tax Paid | Tax Assessment Tax Assessment Total Assessment is a certain percentage of the fair market value that is determined by local assessors to be the total taxable value of land and additions on the property. | Land | Improvement |
|---|---|---|---|---|
| 2025 | $2,961 | $570,700 | $137,300 | $433,400 |
| 2024 | $2,961 | $569,600 | $135,900 | $433,700 |
| 2023 | $2,848 | $516,400 | $122,400 | $394,000 |
| 2022 | $2,904 | $518,100 | $120,000 | $398,100 |
| 2021 | $2,333 | $378,800 | $90,000 | $288,800 |
| 2020 | $2,268 | $345,700 | $90,000 | $255,700 |
| 2019 | $2,250 | $336,200 | $90,000 | $246,200 |
| 2018 | $2,120 | $314,300 | $88,800 | $225,500 |
| 2017 | $2,028 | $299,300 | $88,800 | $210,500 |
| 2016 | $1,892 | $262,300 | $88,800 | $173,500 |
| 2015 | $1,892 | $255,800 | $90,500 | $165,300 |
| 2014 | $1,811 | $241,100 | $86,300 | $154,800 |
Source: Public Records
Map
Nearby Homes
- 8534 S Redwood Rd
- 8518 S Redwood Rd
- 8510 S Redwood Rd
- 1689 W 8295 S Unit 2
- 1434 Autumn Oak Cir
- 1633 W Rockaway Ln
- 1773 W 8760 S
- 8686 S Temple Dr
- 1790 W Sugar Factory Rd
- 1352 W 8780 S
- 1424 Stone Meadow Dr
- 8155 S Redwood Rd Unit 88
- 8155 S Redwood Rd Unit 142B
- 8155 S Redwood Rd Unit 95
- 8155 S Redwood Rd Unit 28
- 1401 W Stone Meadow Dr
- 8383 S 2200 W
- 1254 W 8680 S
- 2041 W 8820 S
- 8859 S Long Dr