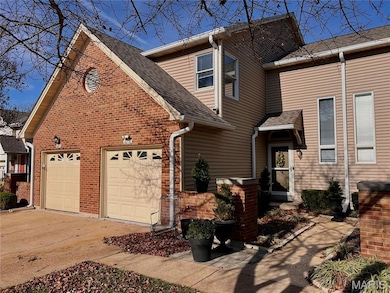
16176 Lea Oak Ct Chesterfield, MO 63017
Estimated payment $2,648/month
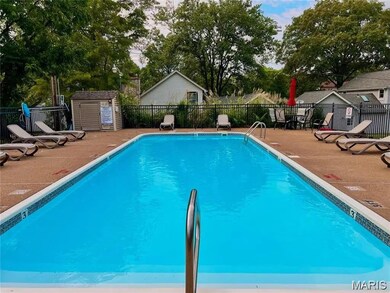
Highlights
- In Ground Pool
- Property is near a park
- 1 Car Attached Garage
- Shenandoah Valley Elementary Rated A
- Traditional Architecture
- Brick Veneer
About This Home
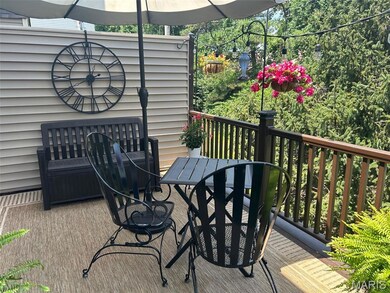
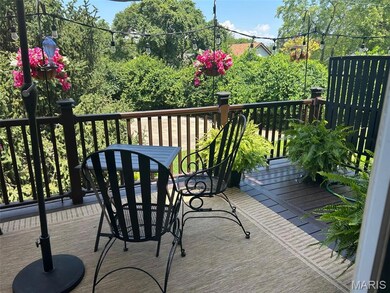
Experience comfort and style in this beautifully updated townhome with a dramatic two-story entry, white shaker kitchen cabinets, granite countertops, stainless steel appliances, and hardwood floors throughout the main living areas. The living room features a stack stone fireplace, while the main floor also includes a convenient half bath and access to a newly replaced, low-maintenance deck overlooking private wooded views. Upstairs, the oversized primary suite impresses with vaulted ceilings, double closets with custom inserts, and a luxurious ensuite featuring a large walk-in shower and generous vanity area. A second bedroom and full bathroom complete the upper level. The finished lower-level rec room offers flexible space for entertaining or relaxation. Perfectly located just minutes from shopping, dining, parks, and the Chesterfield Amphitheater, this home also offers incredible community amenities, including a sparkling pool, landscaping, roof and snow maintenance, and meticulously maintained common grounds. Move in and enjoy low-maintenance, effortless living in one of Chesterfield’s most sought-after communities!
Property Details
Home Type
- Condominium
Est. Annual Taxes
- $2,826
Year Built
- Built in 1987
Lot Details
- Landscaped
HOA Fees
- $360 Monthly HOA Fees
Parking
- 1 Car Attached Garage
Home Design
- Traditional Architecture
- Brick Veneer
- Vinyl Siding
Interior Spaces
- 2-Story Property
- Gas Log Fireplace
- Living Room with Fireplace
Bedrooms and Bathrooms
- 2 Bedrooms
Partially Finished Basement
- Basement Fills Entire Space Under The House
- Basement Ceilings are 8 Feet High
- Basement Storage
Pool
- In Ground Pool
- Fiberglass Pool
- Fence Around Pool
Location
- Property is near a park
- Property is near public transit
Schools
- Shenandoah Valley Elem. Elementary School
- Central Middle School
- Parkway Central High School
Utilities
- Forced Air Heating and Cooling System
- Natural Gas Connected
- Phone Available
- Cable TV Available
Listing and Financial Details
- Assessor Parcel Number 19S-41-0735
Community Details
Overview
- Association fees include insurance, ground maintenance, maintenance parking/roads, common area maintenance, exterior maintenance, pool maintenance, management, pool, roof, sewer, snow removal, trash, water
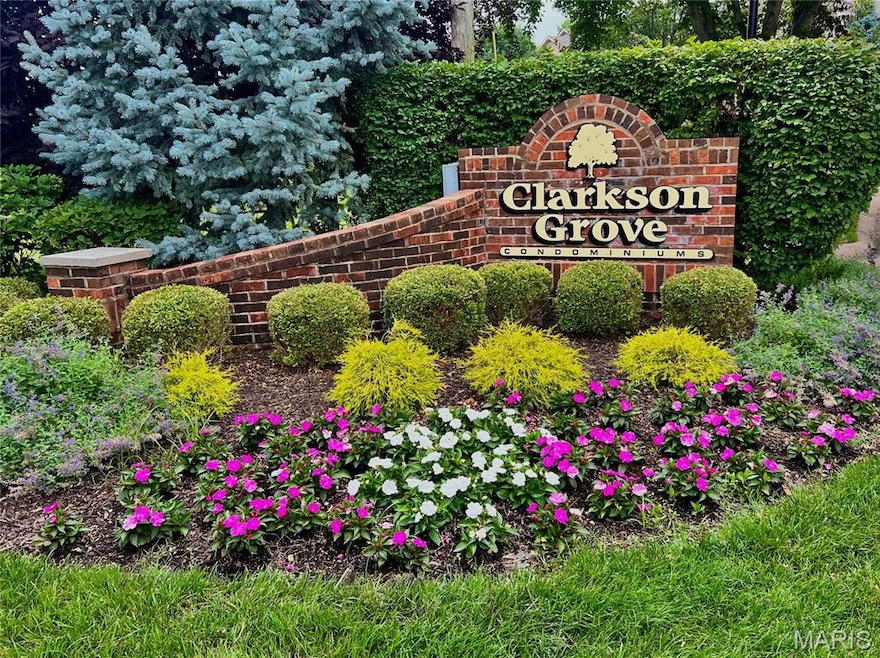
- Clarkson Grove Association
- Community Parking
Amenities
- Common Area
Recreation
- Community Pool
Map
Home Values in the Area
Average Home Value in this Area
Tax History
| Year | Tax Paid | Tax Assessment Tax Assessment Total Assessment is a certain percentage of the fair market value that is determined by local assessors to be the total taxable value of land and additions on the property. | Land | Improvement |
|---|---|---|---|---|
| 2025 | $2,826 | $57,840 | $27,530 | $30,310 |
| 2024 | $2,826 | $42,520 | $11,530 | $30,990 |
| 2023 | $2,711 | $42,520 | $11,530 | $30,990 |
| 2022 | $2,694 | $38,450 | $11,530 | $26,920 |
| 2021 | $2,683 | $38,450 | $11,530 | $26,920 |
| 2020 | $2,618 | $36,030 | $10,490 | $25,540 |
| 2019 | $2,561 | $36,030 | $10,490 | $25,540 |
| 2018 | $2,152 | $28,020 | $5,240 | $22,780 |
| 2017 | $2,094 | $28,020 | $5,240 | $22,780 |
| 2016 | $2,097 | $26,670 | $5,240 | $21,430 |
| 2015 | $2,198 | $26,670 | $5,240 | $21,430 |
| 2014 | $1,887 | $24,440 | $6,100 | $18,340 |
Purchase History
| Date | Type | Sale Price | Title Company |
|---|---|---|---|
| Warranty Deed | -- | Continental Title | |
| Warranty Deed | $147,500 | Investors Title Co Clayton | |
| Special Warranty Deed | $147,500 | Investors Title Co Clayton | |
| Interfamily Deed Transfer | -- | None Available | |
| Interfamily Deed Transfer | -- | -- |
Mortgage History
| Date | Status | Loan Amount | Loan Type |
|---|---|---|---|
| Open | $40,650 | New Conventional | |
| Previous Owner | $110,625 | New Conventional |
Source: MARIS MLS
MLS Number: MIS25077393
APN: 19S-41-0735
Disclaimer: Certain information contained herein is derived from information provided by parties other than Homes.com. All information provided is deemed reliable, but is not guaranteed to be accurate and should be independently verified.
![]() Based on information submitted to the MLS GRID. All data is obtained from various sources and may not have been verified by broker or MLS GRID. Supplied Open House Information is subject to change without notice. All information should be independently reviewed and verified for accuracy. Properties may or may not be listed by the office/agent presenting the information. Some IDX listings have been excluded from this website.
Based on information submitted to the MLS GRID. All data is obtained from various sources and may not have been verified by broker or MLS GRID. Supplied Open House Information is subject to change without notice. All information should be independently reviewed and verified for accuracy. Properties may or may not be listed by the office/agent presenting the information. Some IDX listings have been excluded from this website.
The Digital Millennium Copyright Act of 1998, 17 U.S.C. § 512 (the “DMCA”) provides recourse for copyright owners who believe that material appearing on the Internet infringes their rights under U.S. copyright law. If you believe in good faith that any content or material made available in connection with our website or services infringes your copyright, you (or your agent) may send us a notice requesting that the content or material be removed, or access to it blocked.
Notices must be sent in writing by email to DMCAnotice@MLSGrid.com.
The DMCA requires that your notice of alleged copyright infringement include the following information:
(1) description of the copyrighted work that is the subject of claimed infringement;
(2) description of the alleged infringing content and information sufficient to permit us to locate the content;
(3) contact information for you, including your address, telephone number and email address;
(4) a statement by you that you have a good faith belief that the content in the manner complained of is not authorized by the copyright owner, or its agent, or by the operation of any law;
(5) a statement by you, signed under penalty of perjury, that the information in the notification is accurate and that you have the authority to enforce the copyrights that are claimed to be infringed; and
(6) a physical or electronic signature of the copyright owner or a person authorized to act on the copyright owner’s behalf. Failure to include all of the above information may result in the delay of the processing of your complaint.
- 1621 Walpole Dr Unit B
- 1566 Milbridge Dr Unit 13
- 1611 Walpole Dr Unit C
- 1521 Hedgeford Dr Unit 9
- 1521 Hedgeford Dr Unit 8
- 1666 Old Baxter Rd
- 15593 Bedford Forge Dr Unit 6
- 1512 Bedford Forge Ct Unit 24
- 15561 Highcroft Dr
- 1530 Bedford Forge Ct Unit 5
- 1530 Bedford Forge Ct Unit 15
- 15966 Quiet Oak Rd
- 1511 Hampton Hall Dr Unit 19 & 20
- 1525 Hampton Hall Dr Unit 5
- 735 Stonebluff Ct
- 1991 Chesterfield Ridge Cir
- 831 Stone Meadow Dr
- 1754 Summer Lake Dr
- 16473 Burkhardt Place
- 1910 Walden Pond Ct
- 1570 Westmeade Dr
- 16346 Lydia Hill Dr Unit 2214.1409969
- 16346 Lydia Hill Dr Unit 2-2325.1407561
- 16346 Lydia Hill Dr Unit 2109.1409972
- 16346 Lydia Hill Dr Unit 2210.1409970
- 16346 Lydia Hill Dr Unit 3-3409.1407559
- 16346 Lydia Hill Dr Unit 2114.1409973
- 16346 Lydia Hill Dr Unit 3-3309.1407558
- 16346 Lydia Hill Dr Unit 1410.1405892
- 16346 Lydia Hill Dr Unit 2311.1405893
- 16346 Lydia Hill Dr Unit 2-2418.1407560
- 16346 Lydia Hill Dr Unit 3213.1405895
- 16346 Lydia Hill Dr Unit 1104.1409971
- 16346 Lydia Hill Dr Unit 2-2224.1407562
- 16346 Lydia Hill Dr Unit 2416.1405894
- 16346 Lydia Hill Dr Unit 3325.1405896
- 16346 Lydia Hill Dr
- 15480 Elk Ridge Ln
- 975 Westmeade Dr
- 16460 Wildhorse Lake Blvd Unit 402
