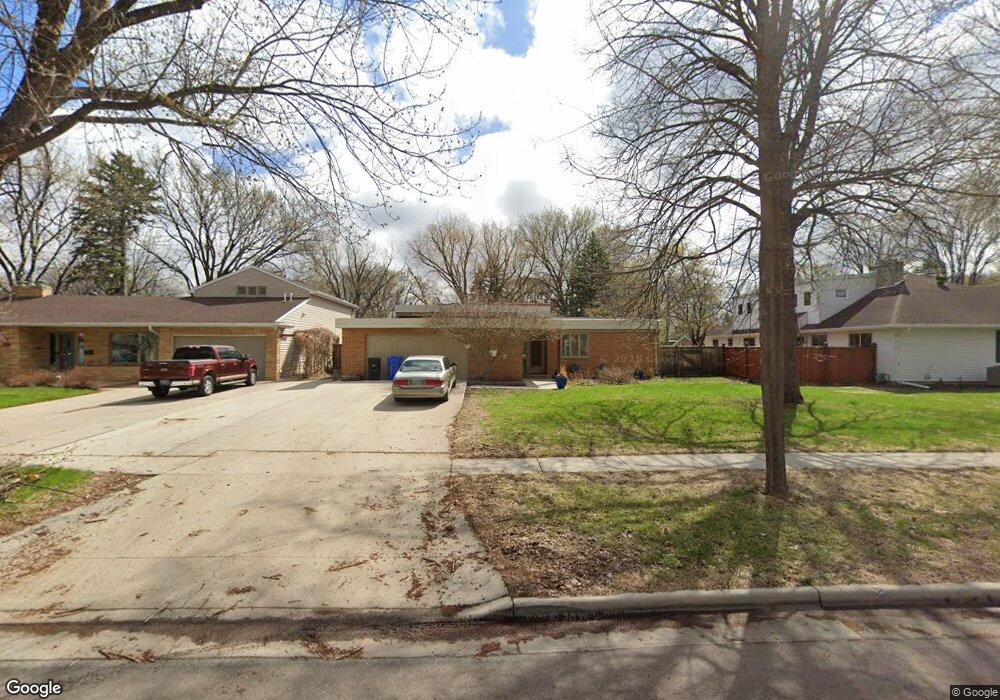
1618 7th St S Fargo, ND 58103
Clara Barton NeighborhoodEstimated Value: $348,000 - $578,000
3
Beds
4
Baths
3,210
Sq Ft
$142/Sq Ft
Est. Value
About This Home
This home is located at 1618 7th St S, Fargo, ND 58103 and is currently estimated at $456,689, approximately $142 per square foot. 1618 7th St S is a home located in Cass County with nearby schools including Clara Barton Elementary School, Carl Ben Eielson Middle School, and South High School.
Ownership History
Date
Name
Owned For
Owner Type
Purchase Details
Closed on
Sep 29, 2008
Sold by
Glover Jessica
Bought by
Nelson Scott W and Bohnenblust Elizabeth A
Current Estimated Value
Home Financials for this Owner
Home Financials are based on the most recent Mortgage that was taken out on this home.
Original Mortgage
$199,920
Outstanding Balance
$132,943
Interest Rate
6.43%
Mortgage Type
New Conventional
Estimated Equity
$323,746
Purchase Details
Closed on
Mar 20, 2008
Sold by
Glover Rodney F
Bought by
Glover Jessica C
Create a Home Valuation Report for This Property
The Home Valuation Report is an in-depth analysis detailing your home's value as well as a comparison with similar homes in the area
Home Values in the Area
Average Home Value in this Area
Purchase History
| Date | Buyer | Sale Price | Title Company |
|---|---|---|---|
| Nelson Scott W | -- | -- | |
| Glover Jessica C | -- | -- |
Source: Public Records
Mortgage History
| Date | Status | Borrower | Loan Amount |
|---|---|---|---|
| Open | Nelson Scott W | $199,920 |
Source: Public Records
Tax History Compared to Growth
Tax History
| Year | Tax Paid | Tax Assessment Tax Assessment Total Assessment is a certain percentage of the fair market value that is determined by local assessors to be the total taxable value of land and additions on the property. | Land | Improvement |
|---|---|---|---|---|
| 2024 | $5,982 | $201,400 | $52,400 | $149,000 |
| 2023 | $5,697 | $191,800 | $52,400 | $139,400 |
| 2022 | $5,680 | $188,050 | $52,400 | $135,650 |
| 2021 | $5,205 | $173,700 | $51,150 | $122,550 |
| 2020 | $5,173 | $173,700 | $51,150 | $122,550 |
| 2019 | $4,696 | $156,500 | $32,200 | $124,300 |
| 2018 | $4,642 | $156,500 | $32,200 | $124,300 |
| 2017 | $4,482 | $151,950 | $32,200 | $119,750 |
| 2016 | $4,053 | $147,500 | $32,200 | $115,300 |
| 2015 | $4,267 | $146,800 | $19,900 | $126,900 |
| 2014 | $4,178 | $139,800 | $19,900 | $119,900 |
| 2013 | $4,350 | $139,800 | $19,900 | $119,900 |
Source: Public Records
Map
Nearby Homes
- 1439 10th St S
- 1425 11th St S
- 1550 13 1 2 St S
- 1361 16th Ave S
- 1710 14th St S
- 1301 10th St S
- 1550 14 1 2 St S
- 1208 University Dr S
- 403 11th Ave S Unit 2
- 1718 15th St S
- 1124 University Dr S
- 1314 14th St S
- 1834 14 1 2 St S
- 1112 University Dr S
- 1545 15th St S
- 1119 Elm St S
- 2309 9th St S
- 911 8th St S
- 1313 2nd St S
- 1708 3rd St S