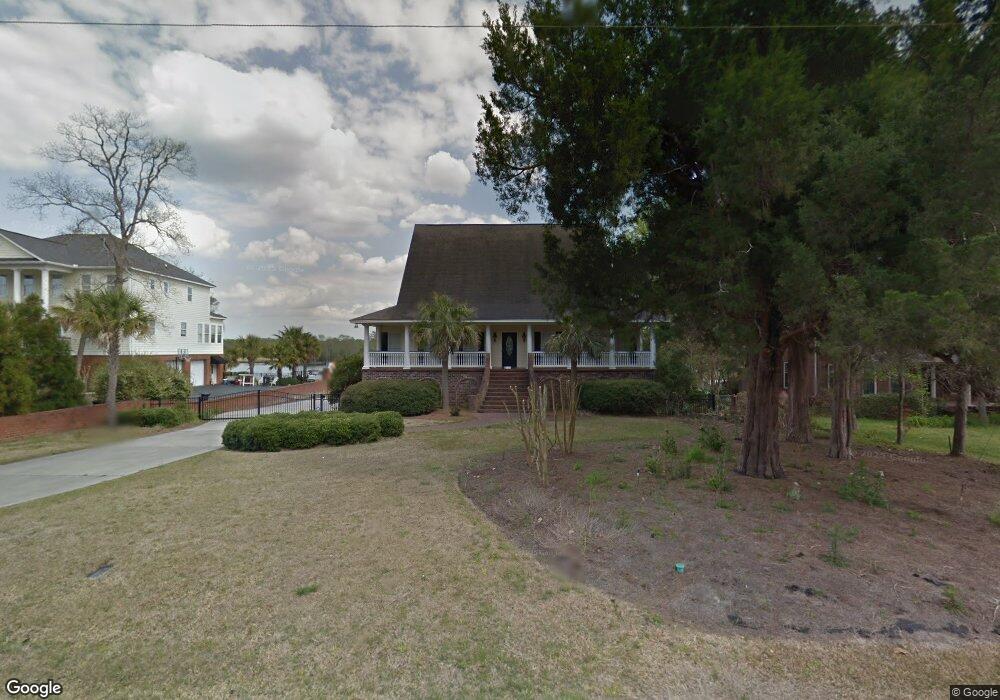
1618 Dennis Blvd Moncks Corner, SC 29461
Estimated Value: $665,000 - $838,202
4
Beds
4
Baths
3,720
Sq Ft
$200/Sq Ft
Est. Value
About This Home
This home is located at 1618 Dennis Blvd, Moncks Corner, SC 29461 and is currently estimated at $743,551, approximately $199 per square foot. 1618 Dennis Blvd is a home located in Berkeley County with nearby schools including Moncks Corner Elementary School, Berkeley Middle School, and Berkeley High School.
Ownership History
Date
Name
Owned For
Owner Type
Purchase Details
Closed on
Jan 27, 2014
Sold by
Fletcher Matthew and Fletcher Angela
Bought by
Fletcher Matthew and Fletcher Angela
Current Estimated Value
Purchase Details
Closed on
Mar 19, 2012
Sold by
U S Bank National Association
Bought by
Fletcher Matthew and Fletcher Angela
Purchase Details
Closed on
Feb 7, 2012
Sold by
Griffith Trudi A and Griffith Rodney E
Bought by
U S Bank National Association
Purchase Details
Closed on
Sep 16, 2006
Sold by
Edwards T Graham and Edwards Dinah M
Bought by
Griffith Trudi A and Griffith Rodney E
Home Financials for this Owner
Home Financials are based on the most recent Mortgage that was taken out on this home.
Original Mortgage
$86,200
Interest Rate
6.27%
Mortgage Type
Credit Line Revolving
Create a Home Valuation Report for This Property
The Home Valuation Report is an in-depth analysis detailing your home's value as well as a comparison with similar homes in the area
Home Values in the Area
Average Home Value in this Area
Purchase History
| Date | Buyer | Sale Price | Title Company |
|---|---|---|---|
| Fletcher Matthew | -- | -- | |
| Fletcher Matthew | $580,000 | -- | |
| U S Bank National Association | $520,000 | -- | |
| Griffith Trudi A | $818,000 | None Available |
Source: Public Records
Mortgage History
| Date | Status | Borrower | Loan Amount |
|---|---|---|---|
| Previous Owner | Griffith Trudi A | $86,200 | |
| Previous Owner | Griffith Trudi A | $650,000 |
Source: Public Records
Tax History
| Year | Tax Paid | Tax Assessment Tax Assessment Total Assessment is a certain percentage of the fair market value that is determined by local assessors to be the total taxable value of land and additions on the property. | Land | Improvement |
|---|---|---|---|---|
| 2025 | $3,086 | $777,300 | $224,000 | $553,300 |
| 2024 | $2,985 | $31,092 | $8,960 | $22,132 |
| 2023 | $2,985 | $31,092 | $8,960 | $22,132 |
| 2022 | $3,037 | $27,379 | $14,817 | $12,562 |
| 2021 | $3,124 | $27,380 | $14,817 | $12,562 |
| 2020 | $3,169 | $27,379 | $14,817 | $12,562 |
| 2019 | $3,144 | $27,379 | $14,817 | $12,562 |
| 2018 | $2,855 | $23,808 | $12,000 | $11,808 |
| 2017 | $2,682 | $23,808 | $12,000 | $11,808 |
| 2016 | $2,755 | $23,810 | $12,000 | $11,810 |
| 2015 | $2,512 | $23,810 | $12,000 | $11,810 |
| 2014 | $4,955 | $23,810 | $12,000 | $11,810 |
| 2013 | -- | $23,810 | $12,000 | $11,810 |
Source: Public Records
Map
Nearby Homes
- 407 Spruce Ivy St
- 639 Red Mulberry Rd
- 529 Shady Maple St
- 522 Shady Maple St
- 500 Shady Maple St
- 361 Spruce Ivy St
- 440 Blue Elderberry Run
- 1330 Dennis Blvd
- 1310 Edward Dr
- 1530 Sterling Oaks Dr
- 1109 Hollybrooke Dr
- 1401 Cooper River Blvd
- 1102 Quenby Ln
- 1104 Quenby Ln
- 1208 Edward Dr
- 1218 Dennis Blvd
- 126 Fennick Dr
- 201 Selbee St
- 220 N Highway 52
- 126 U S 52
- 1620 Dennis Blvd
- 1616 Dennis Blvd
- 1614 Dennis Blvd
- 1622 Dennis Blvd
- 1617 Dennis Blvd
- 1615 Dennis Blvd
- 1624 Dennis Blvd
- 1612 Dennis Blvd
- 1619 Dennis Blvd
- 1618 Cedar Ave
- 1616 Cedar Ave
- 1626 Dennis Blvd
- 1620 Cedar Ave
- 1623 Dennis Blvd
- 1614 Cedar Ave
- 1622 Cedar Ave
- 1612 Cedar Ave
- 1628 Dennis Blvd
- 1625 Dennis Blvd
- 1608 Dennis Blvd
Your Personal Tour Guide
Ask me questions while you tour the home.