Estimated Value: $589,140 - $618,000
4
Beds
2
Baths
1,452
Sq Ft
$417/Sq Ft
Est. Value
About This Home
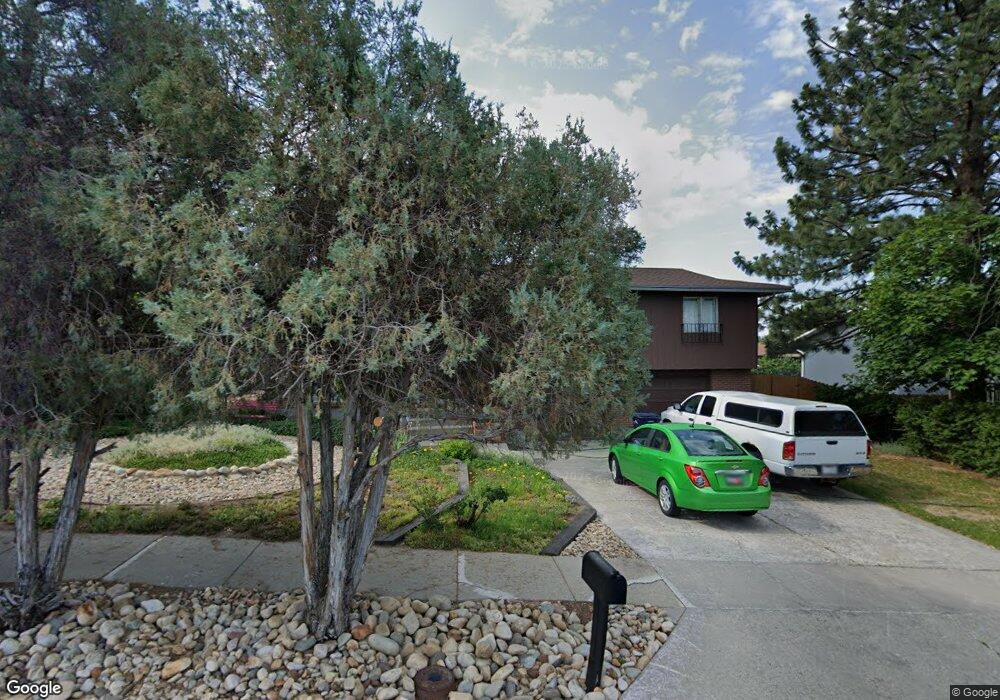
This home is located at 1618 E 8685 S, Sandy, UT 84093 and is currently estimated at $605,785, approximately $417 per square foot. 1618 E 8685 S is a home located in Salt Lake County with nearby schools including Peruvian Park Elementary School, Union Middle School, and Hillcrest High School.
Ownership History
Date
Name
Owned For
Owner Type
Purchase Details
Closed on
Apr 16, 2021
Sold by
Louise Ann Cook Of Steepleview Holdings
Bought by
Maxwell Rodney and The Pumpkin Kitty & The Cristi
Current Estimated Value
Purchase Details
Closed on
Apr 30, 2020
Sold by
Cook Louise Ann and Stepleview Holdings Corp
Bought by
Maxwell Rodney and The Crystie Trust
Purchase Details
Closed on
May 16, 2003
Sold by
Cook K Delynn and Cook Louise A
Bought by
Steepleview Holdings Corp
Purchase Details
Closed on
Jul 9, 1993
Sold by
Spafford and Spafford P C
Bought by
Cook K Delynn and Cook Louise A
Home Financials for this Owner
Home Financials are based on the most recent Mortgage that was taken out on this home.
Original Mortgage
$65,000
Interest Rate
7.2%
Create a Home Valuation Report for This Property
The Home Valuation Report is an in-depth analysis detailing your home's value as well as a comparison with similar homes in the area
Home Values in the Area
Average Home Value in this Area
Purchase History
| Date | Buyer | Sale Price | Title Company |
|---|---|---|---|
| Maxwell Rodney | -- | None Available | |
| Maxwell Rodney | -- | None Available | |
| Steepleview Holdings Corp | -- | -- | |
| Cook K Delynn | -- | -- |
Source: Public Records
Mortgage History
| Date | Status | Borrower | Loan Amount |
|---|---|---|---|
| Previous Owner | Cook K Delynn | $65,000 | |
| Closed | Cook K Delynn | $5,000 |
Source: Public Records
Tax History
| Year | Tax Paid | Tax Assessment Tax Assessment Total Assessment is a certain percentage of the fair market value that is determined by local assessors to be the total taxable value of land and additions on the property. | Land | Improvement |
|---|---|---|---|---|
| 2025 | $2,614 | $515,900 | $168,200 | $347,700 |
| 2024 | $2,614 | $489,900 | $157,200 | $332,700 |
| 2023 | $2,555 | $478,100 | $149,400 | $328,700 |
| 2022 | $2,661 | $489,800 | $146,500 | $343,300 |
| 2021 | $2,352 | $368,600 | $118,900 | $249,700 |
| 2020 | $2,163 | $319,800 | $118,900 | $200,900 |
| 2019 | $2,100 | $303,000 | $112,100 | $190,900 |
| 2016 | $1,914 | $267,000 | $112,100 | $154,900 |
Source: Public Records
Map
Nearby Homes
- 1579 E 8730 S
- 8638 Piper Ln
- 8797 S Capella Way
- 1430 E 8685 S
- 8492 S Mesa Dr
- 8642 S Cessna Cir
- 8857 S Capella Way
- 1371 Sudbury Ave
- 8411 S 1475 E
- 1891 Richard Rd
- 1627 E Mulberry Way
- 1482 Waters Ln
- 1924 E Viscounti Cove
- 8352 S 1330 E
- 1990 E Terra Vista Way
- 8569 Round Stone Cove
- 8569 Round Stone Cove Unit 8
- 8492 Fayeway Dr
- 8483 Terrace Dr
- 8935 Quarry Stone Way
Your Personal Tour Guide
Ask me questions while you tour the home.