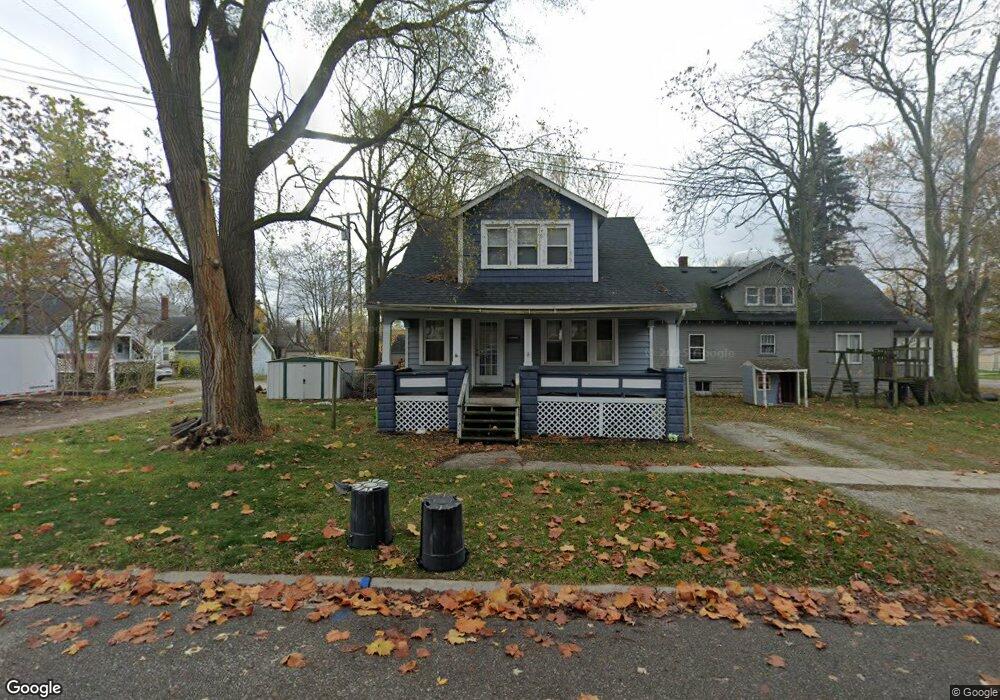
1618 Minnie St Port Huron, MI 48060
Estimated Value: $111,000 - $142,000
3
Beds
1
Bath
1,259
Sq Ft
$100/Sq Ft
Est. Value
About This Home
This home is located at 1618 Minnie St, Port Huron, MI 48060 and is currently estimated at $126,407, approximately $100 per square foot. 1618 Minnie St is a home located in St. Clair County with nearby schools including Michigamme Elementary School, Central Middle School, and Port Huron High School.
Ownership History
Date
Name
Owned For
Owner Type
Purchase Details
Closed on
Mar 2, 2010
Sold by
Secretary Of Housing & Urban Development
Bought by
Reid Mariea
Current Estimated Value
Purchase Details
Closed on
Jul 14, 2009
Sold by
Bank Of New York
Bought by
The Secretary Of Housing & Urban Develop
Purchase Details
Closed on
Jan 9, 2009
Sold by
Mortgage Electronic Registration Systems
Bought by
Bank Of New York
Purchase Details
Closed on
Jan 8, 2009
Sold by
Lewandowski Thomas K and Lewandowski Rachel R
Bought by
Mortgage Electronic Registration Systems
Create a Home Valuation Report for This Property
The Home Valuation Report is an in-depth analysis detailing your home's value as well as a comparison with similar homes in the area
Home Values in the Area
Average Home Value in this Area
Purchase History
| Date | Buyer | Sale Price | Title Company |
|---|---|---|---|
| Reid Mariea | $19,000 | None Available | |
| The Secretary Of Housing & Urban Develop | -- | None Available | |
| Bank Of New York | -- | None Available | |
| Mortgage Electronic Registration Systems | $89,129 | None Available |
Source: Public Records
Tax History Compared to Growth
Tax History
| Year | Tax Paid | Tax Assessment Tax Assessment Total Assessment is a certain percentage of the fair market value that is determined by local assessors to be the total taxable value of land and additions on the property. | Land | Improvement |
|---|---|---|---|---|
| 2025 | $1,481 | $49,000 | $0 | $0 |
| 2024 | $1,091 | $46,500 | $0 | $0 |
| 2023 | $1,031 | $41,600 | $0 | $0 |
| 2022 | $1,136 | $36,200 | $0 | $0 |
| 2021 | $974 | $31,800 | $0 | $0 |
| 2020 | $984 | $28,100 | $28,100 | $0 |
| 2019 | $967 | $24,700 | $0 | $0 |
| 2018 | $946 | $24,700 | $0 | $0 |
| 2017 | $989 | $23,400 | $0 | $0 |
| 2016 | $838 | $23,400 | $0 | $0 |
| 2015 | $886 | $23,300 | $23,300 | $0 |
| 2014 | $886 | $24,700 | $24,700 | $0 |
| 2013 | -- | $27,700 | $0 | $0 |
Source: Public Records
Map
Nearby Homes
- 1610 16th St
- 1624 15th St
- 1917 Minnie St
- 1325 Division St
- 1322 Division St
- 1309 Division St
- 1815 Griswold St
- 1426 18th St
- 1425 18th St
- 1424 19th St
- 1127 Minnie St
- 1413 14th St
- 1112 Minnie St
- 1831 11th St
- 1132 Griswold St
- 1207 White St
- 1811 23rd St
- 2203 VL Railroad St
- 2200 VL Railroad St
- 1219 16th St